AI Lecture Redesign — Case Study

Beamer Lists → Concept Frameworks: Stanford EE104 ML

A real Stanford EE104 Machine Learning Overview lecture with 18 slides — abstract LaTeX Beamer taxonomy bullets transformed into split-panel frameworks, statistical mini-diagrams, train/test flowcharts, and ML workflow pipelines by Arty.

📄 18 slides transformed 🎓 Stanford EE104 — Lall & Boyd 🤖 Style: Academic Lecture

Why This Deck Needs a Redesign

This Stanford EE104 lecture introduces machine learning at a high level — taxonomy, workflows, examples, and course structure. The content is foundational, but the LaTeX Beamer format presents every concept as nested bullet lists with no visual scaffolding:

Arty's redesign turns abstract ML frameworks into teachable visuals — split-panel taxonomy comparisons, phase-coded workflow cards, statistical concept mini-diagrams, train/test split flowcharts with overfit outcomes, input→predictor→output pipelines, framework logo grids, and curriculum roadmaps — while preserving every technical term and definition from the original.

Original lecture from Stanford EE104 — Overview and Examples, Sanjay Lall and Stephen Boyd, Stanford University.
1

Title — EE104: Overview and Examples

Plain Beamer title slide with centered text and no visual identity. The redesign adds a hexagonal network motif and left-aligned professional title layout.

Before
Before: Original slide 1 — plain Beamer title
Centered text on blank white Beamer template
After
After: Redesigned slide 1 with hexagonal network motif
Professional title with hexagonal network accent and clear hierarchy
2

Section Divider — Machine Learning Overview

A bare section title on white. The redesign creates a bold section divider with neural-network visual metaphor.

Before
Before: Original slide 2 — bare section title
Single-line section title, no visual treatment
After

After: Redesigned slide 2 with section divider and neural network visual
Bold section divider with neural-network visual metaphor
3

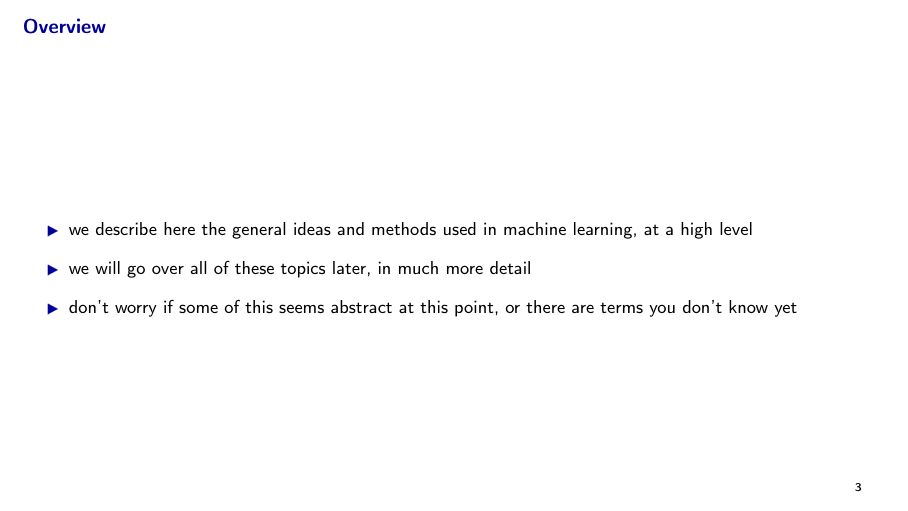
Overview — Course Scope Introduction

Three reassuring bullet points about the lecture scope. The redesign presents them as a structured intro card with visual anchors.

Before
Before: Original slide 3 — three intro bullet points
Three flat bullet points, no structure
After
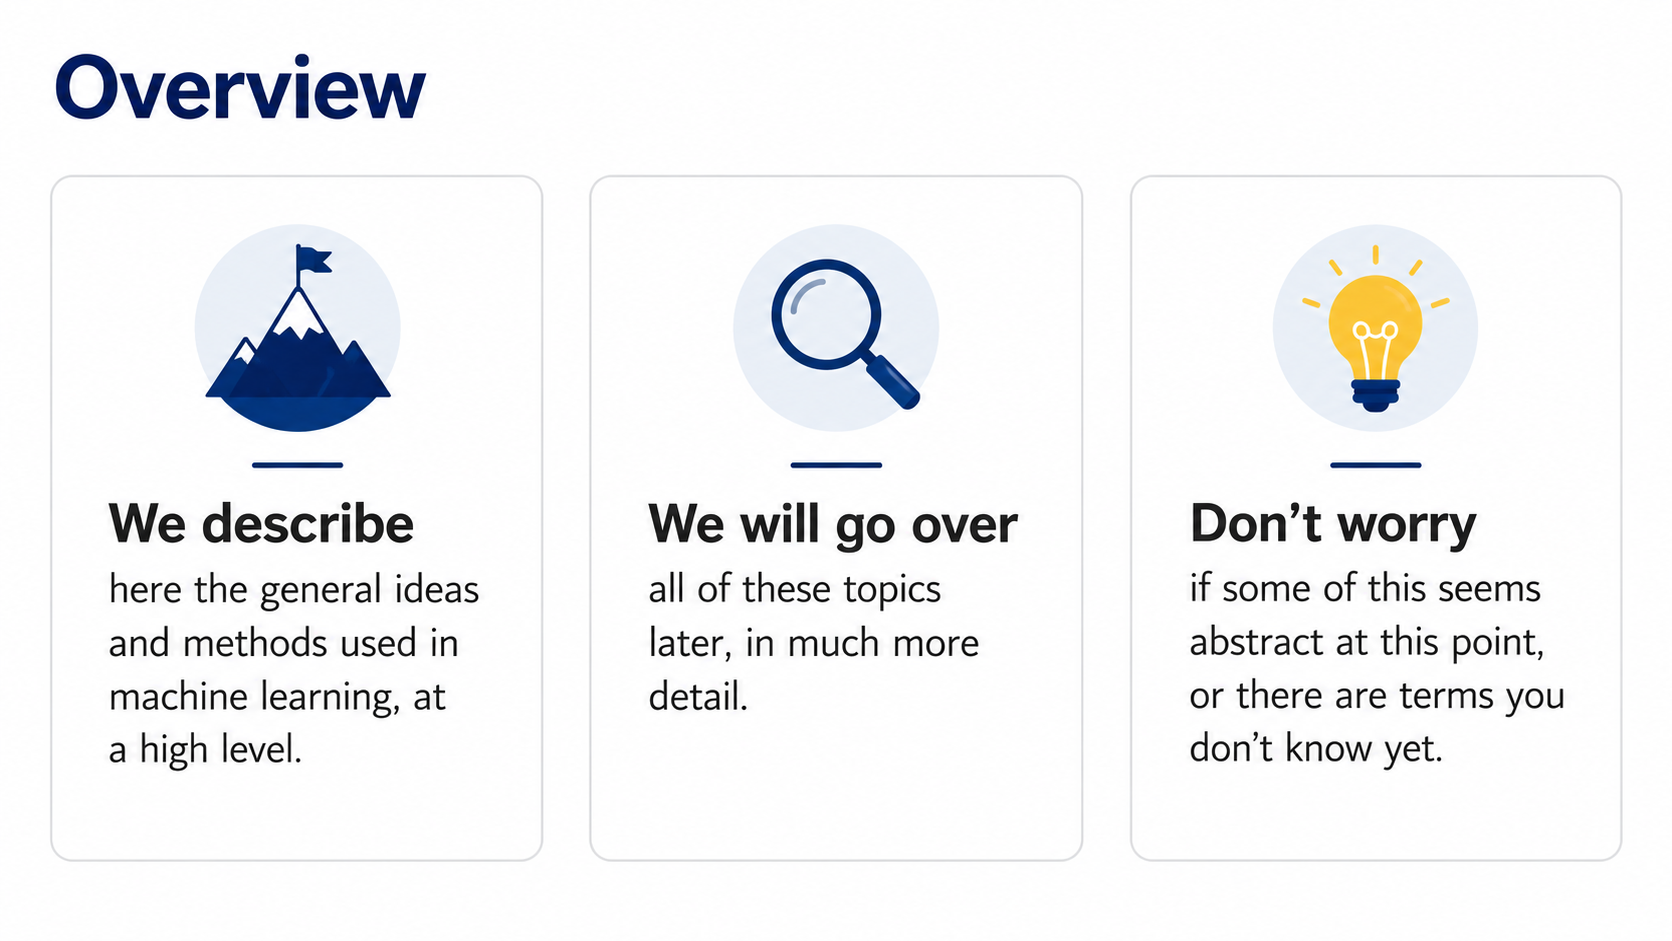
After: Redesigned slide 3 with structured intro cards
Structured intro layout with visual anchors for each point
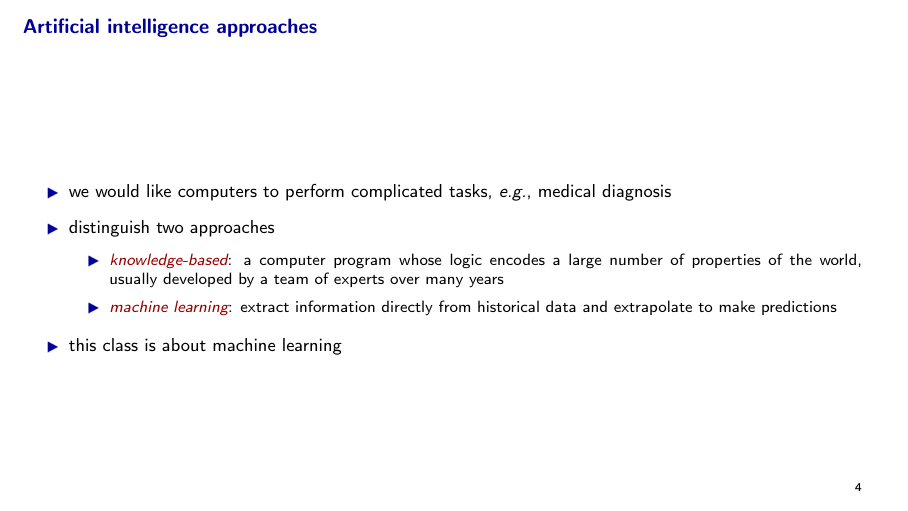
4

AI Approaches — Knowledge-Based vs. Machine Learning

Two AI paradigms described as nested bullets. The redesign creates a side-by-side comparison of knowledge-based and ML approaches.

Before
Before: Original slide 4 — nested bullets on AI approaches
Nested bullets distinguishing two AI paradigms
After

After: Redesigned slide 4 with side-by-side AI paradigm comparison
Side-by-side comparison panels for knowledge-based vs ML
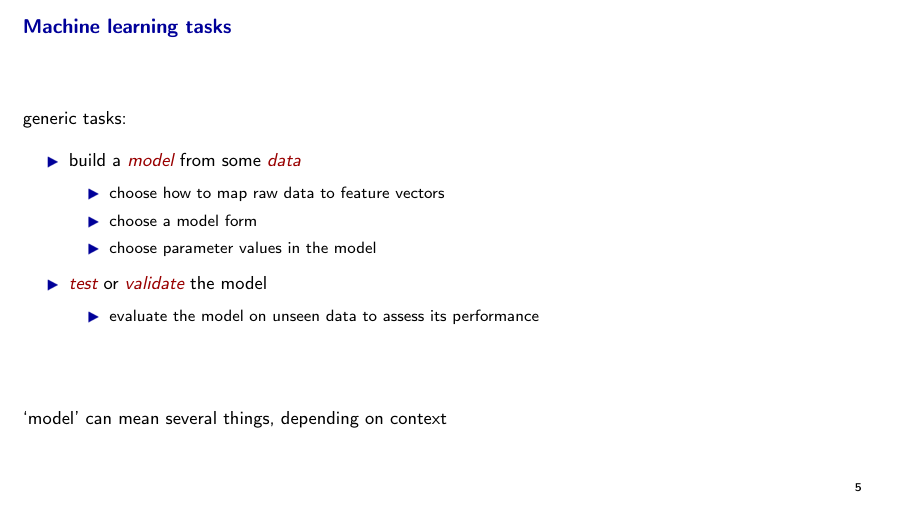
5

ML Tasks — Build vs. Validate Workflow Cards

Nested bullets mixing model-building and validation steps in one list. The redesign splits them into phase-coded cards — blue for "build a model" and teal for "test or validate."

Before
Before: Original slide 5 — nested build and validate bullets
Nested bullets mixing build and validate phases
After
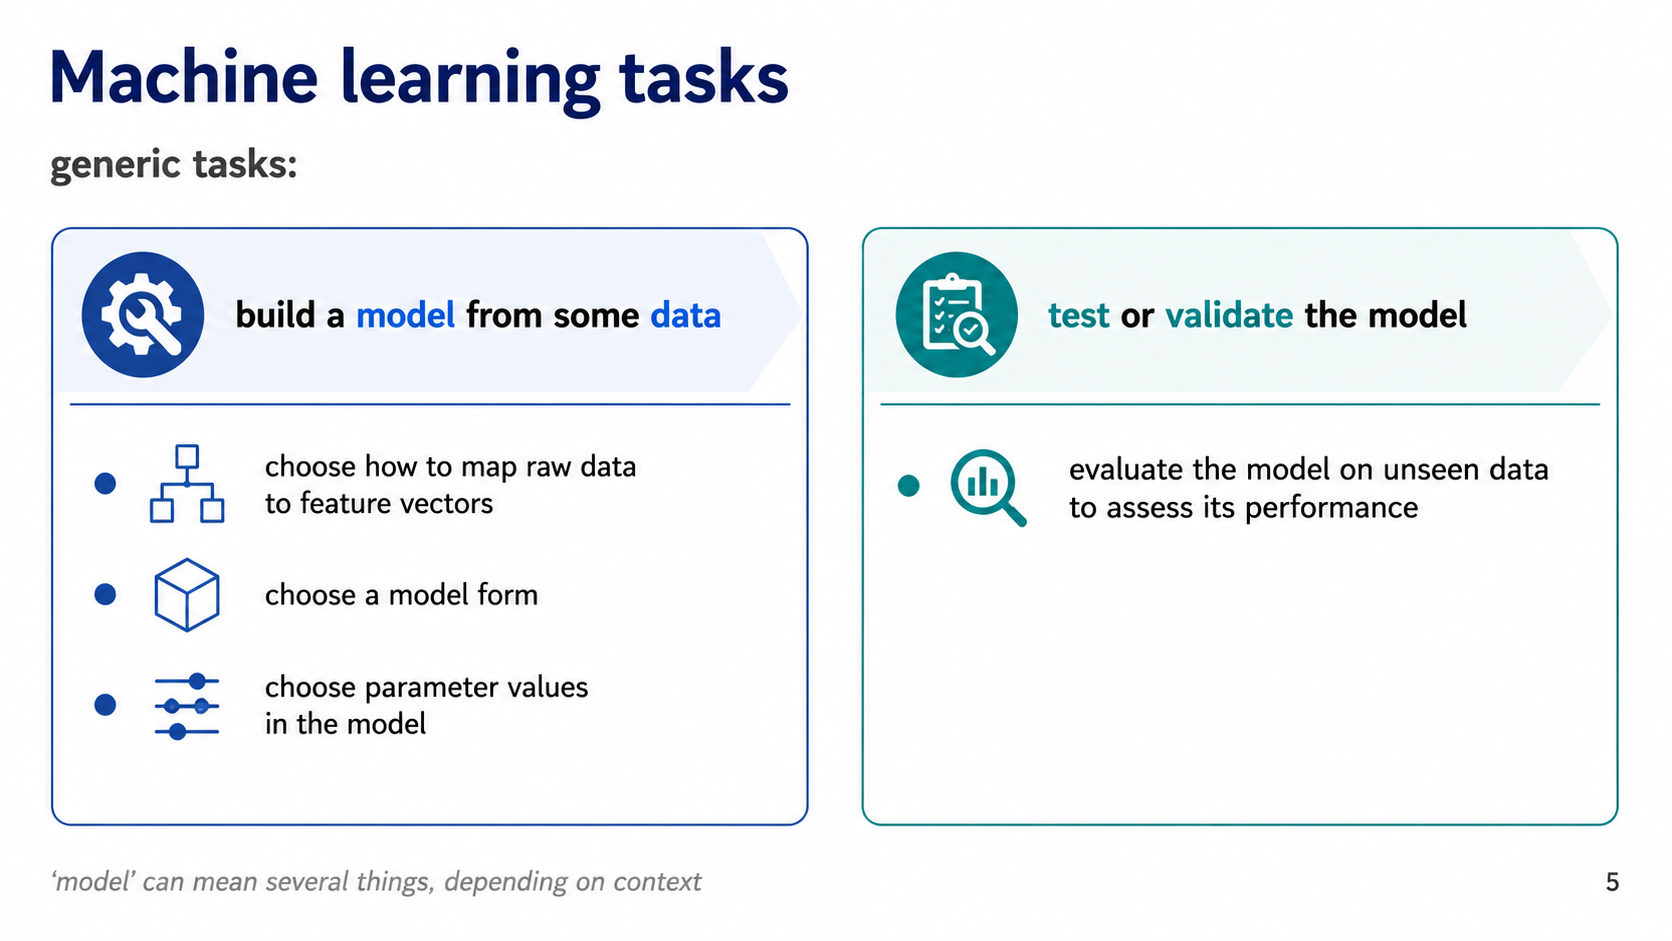
After: Redesigned slide 5 with build vs validate phase cards
Phase-coded dual cards — blue build phase, teal validate phase
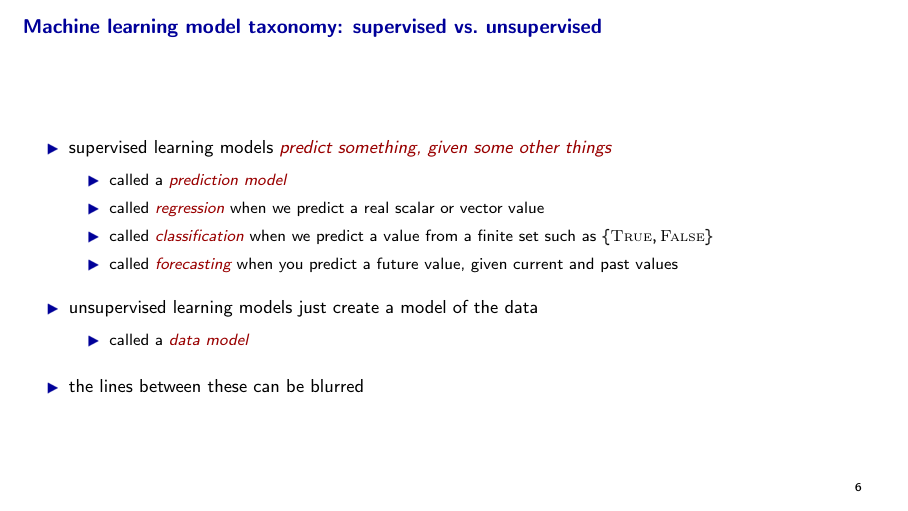
6

Taxonomy — Supervised vs. Unsupervised Split Panel

Supervised and unsupervised learning defined as nested italic bullets. The redesign creates a color-coded split panel — blue for supervised (regression, classification, forecasting) and teal for unsupervised (clustering data model).

Before
Before: Original slide 6 — nested taxonomy bullets
Nested italic bullets, no visual category separation
After
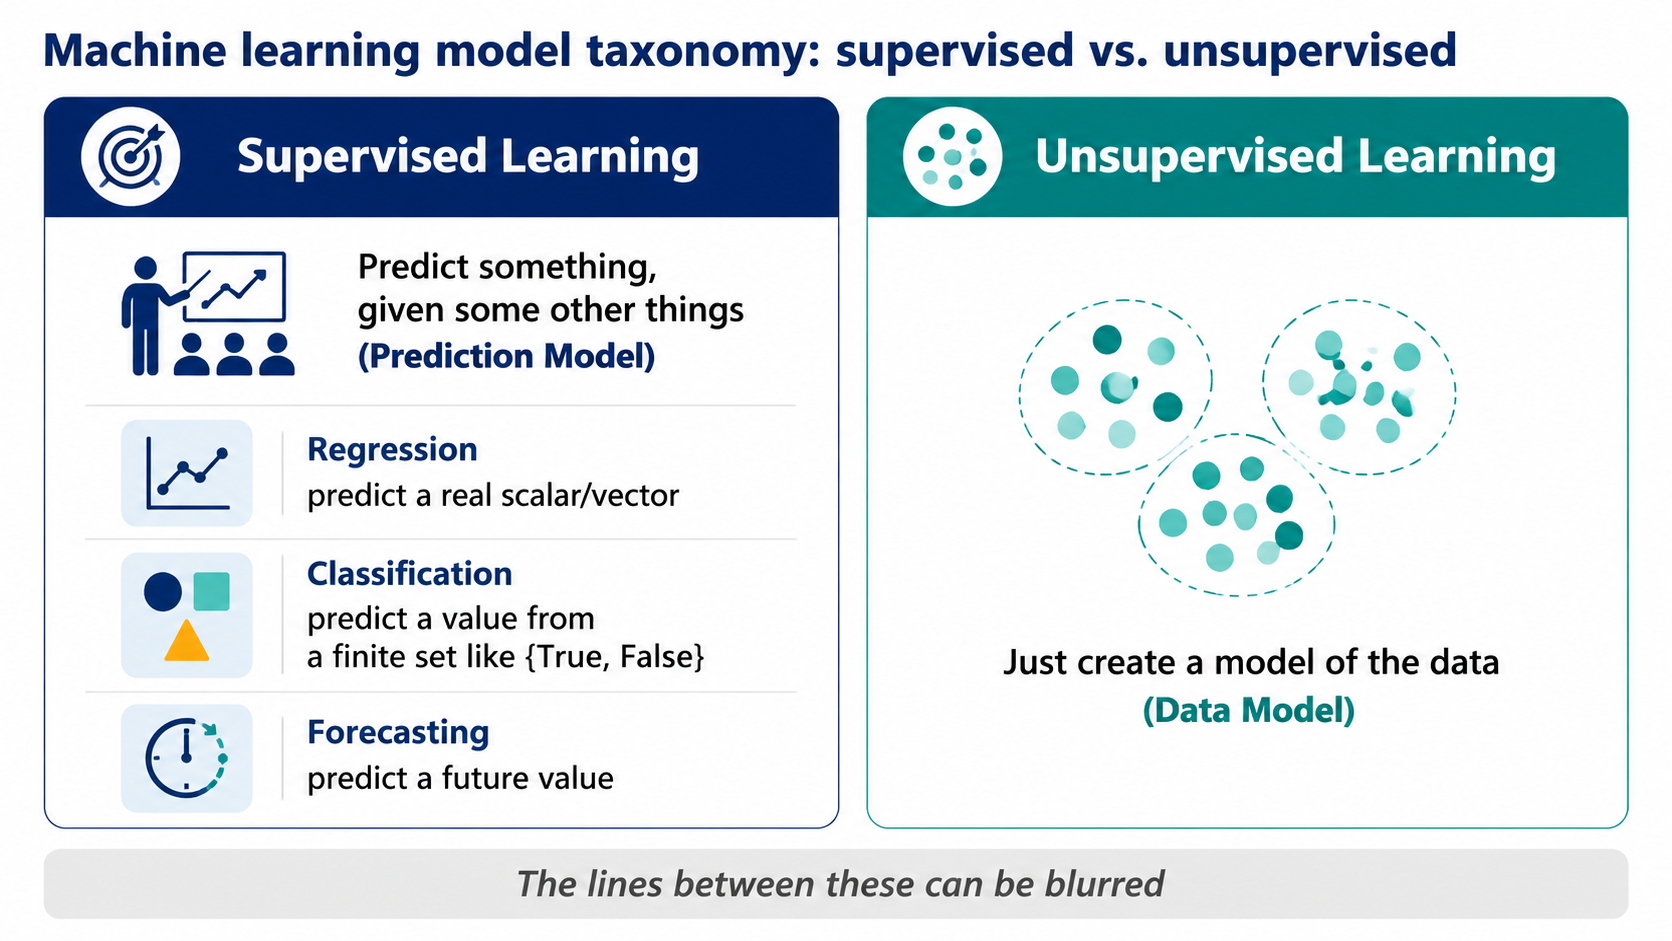
After: Redesigned slide 6 with supervised vs unsupervised split panel
Split-panel taxonomy with concept icons per sub-type
7

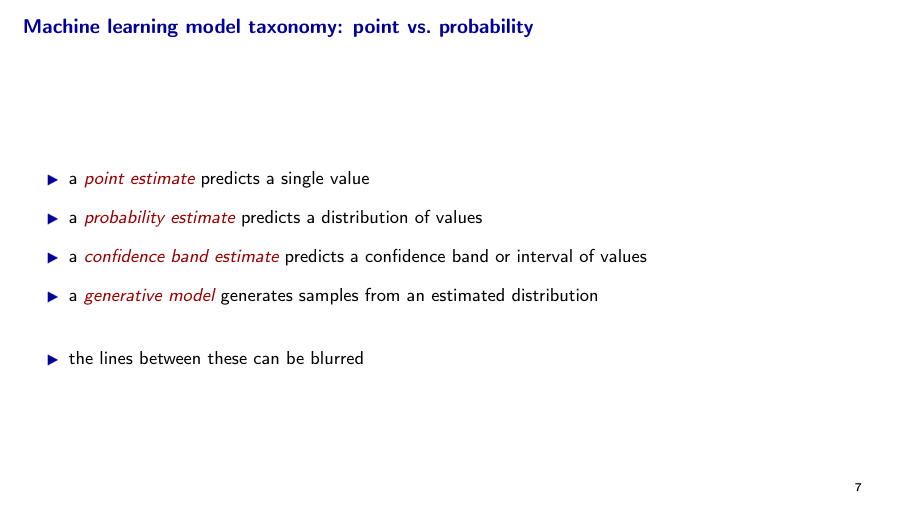
Taxonomy — Point vs. Probability Mini-Diagrams

Four statistical estimate types defined as italic text bullets. The redesign pairs each definition with a mini-diagram — dot on a line, bell curve, confidence band, and sample point cloud.

Before
Before: Original slide 7 — italic text definitions of estimate types
Four italic text definitions, no visual representation
After
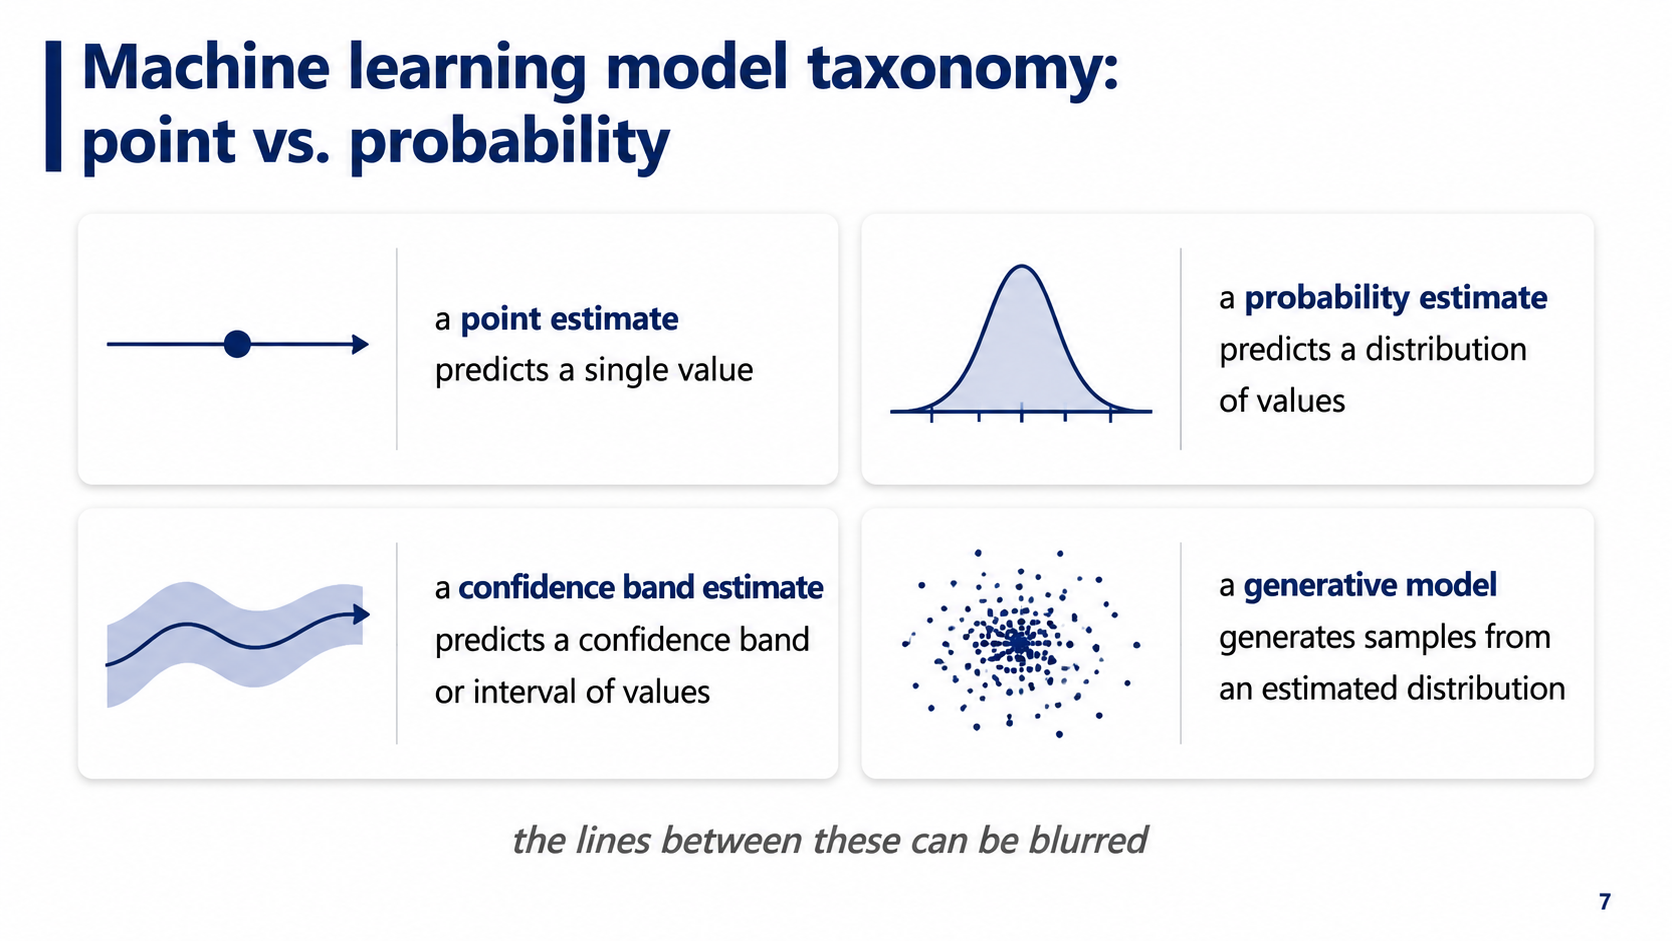
After: Redesigned slide 7 with statistical mini-diagram cards
2×2 grid pairing each estimate type with a mini-diagram
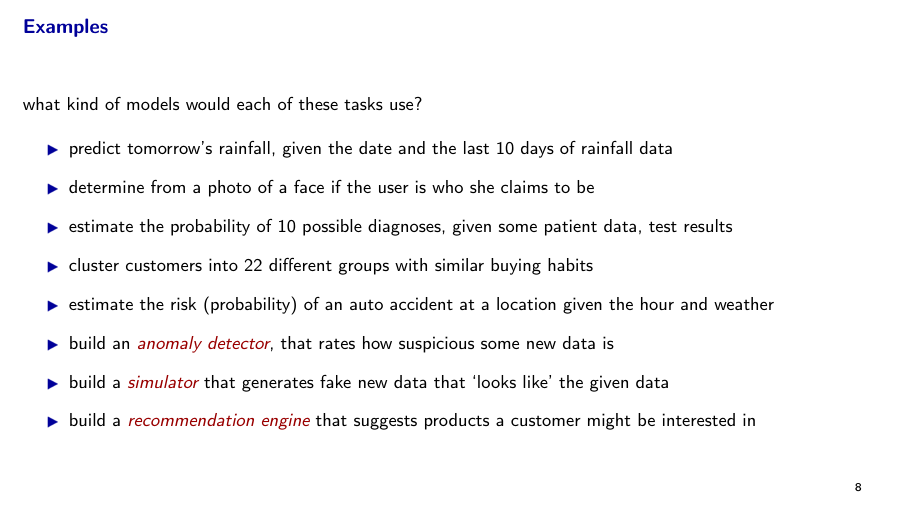
8

Examples — Domain-Specific ML Task Icon Grid

Eight ML task examples as an undifferentiated flat list. The redesign arranges them in a 2×4 card grid — each with a domain icon (rain cloud, face, stethoscope, customers, car, anomaly, simulator, cart).

Before
Before: Original slide 8 — flat list of eight ML tasks
Eight undifferentiated bullet points, no domain context
After
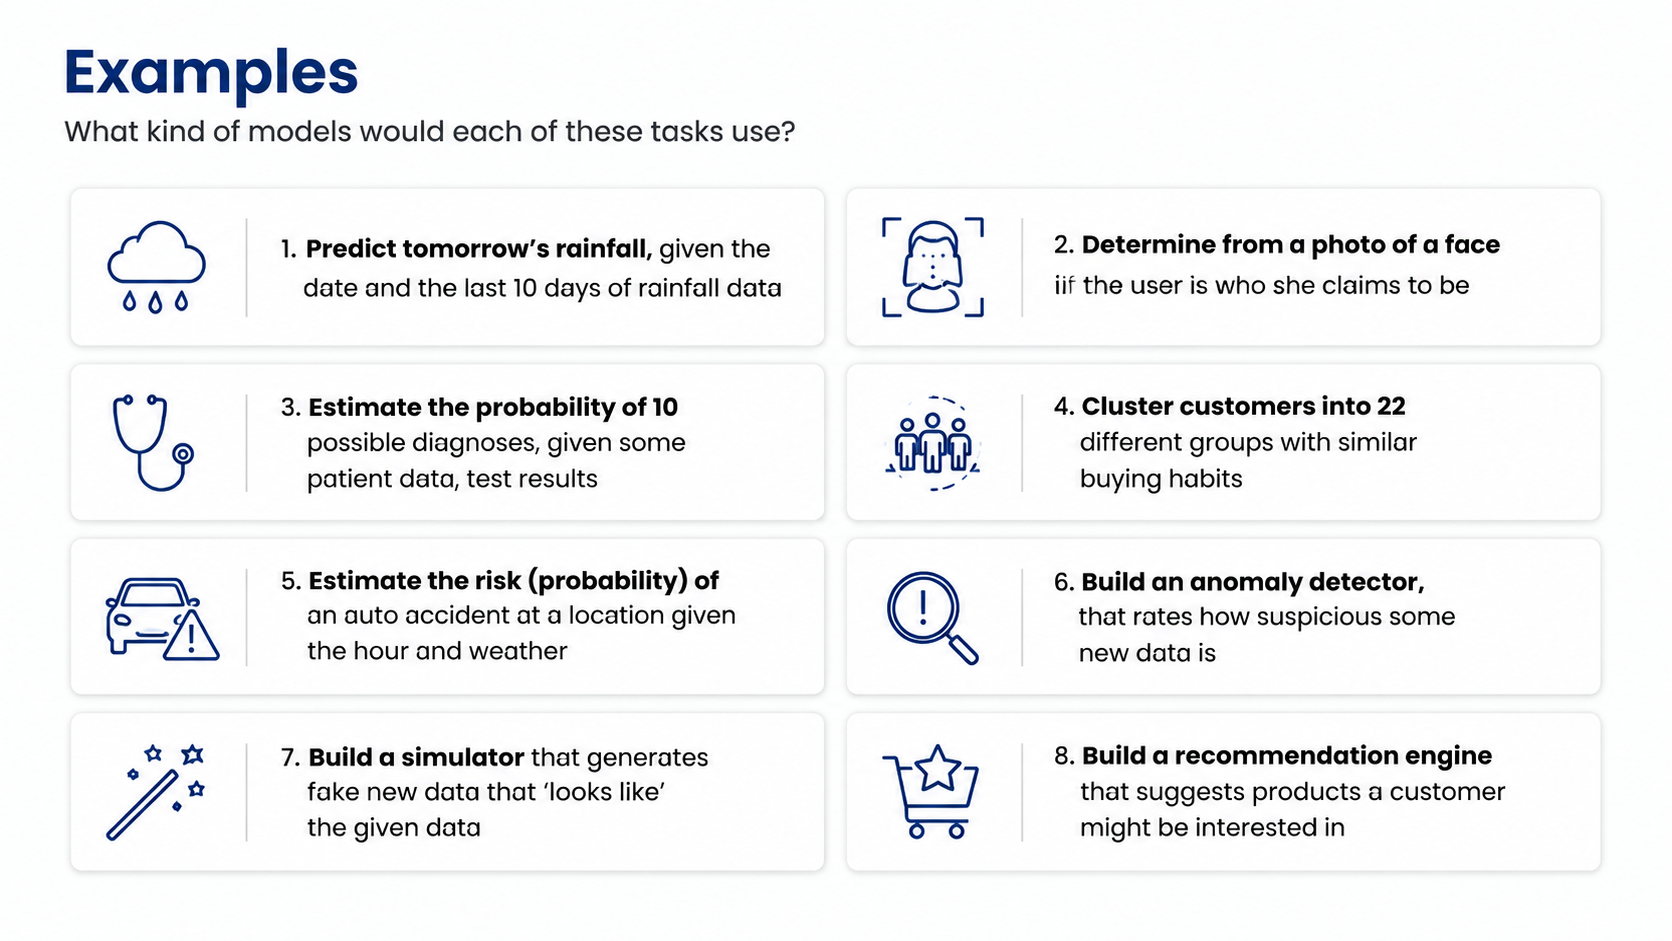
After: Redesigned slide 8 with domain-specific icon card grid
2×4 card grid with domain-specific icons per ML task
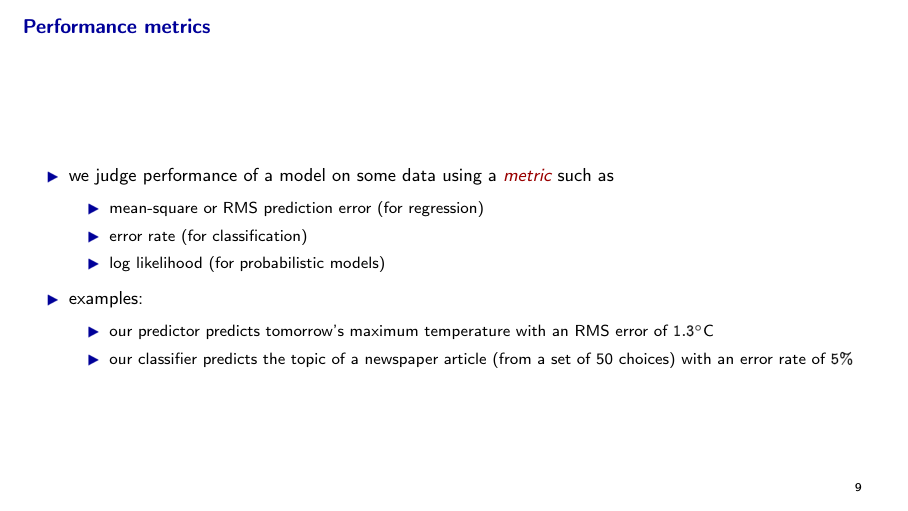
9

Performance Metrics — Evaluation Criteria

Model evaluation metrics listed as bullets. The redesign presents each metric type with a visual indicator and structured layout.

Before
Before: Original slide 9 — flat performance metric bullets
Flat bullet list of evaluation metrics
After
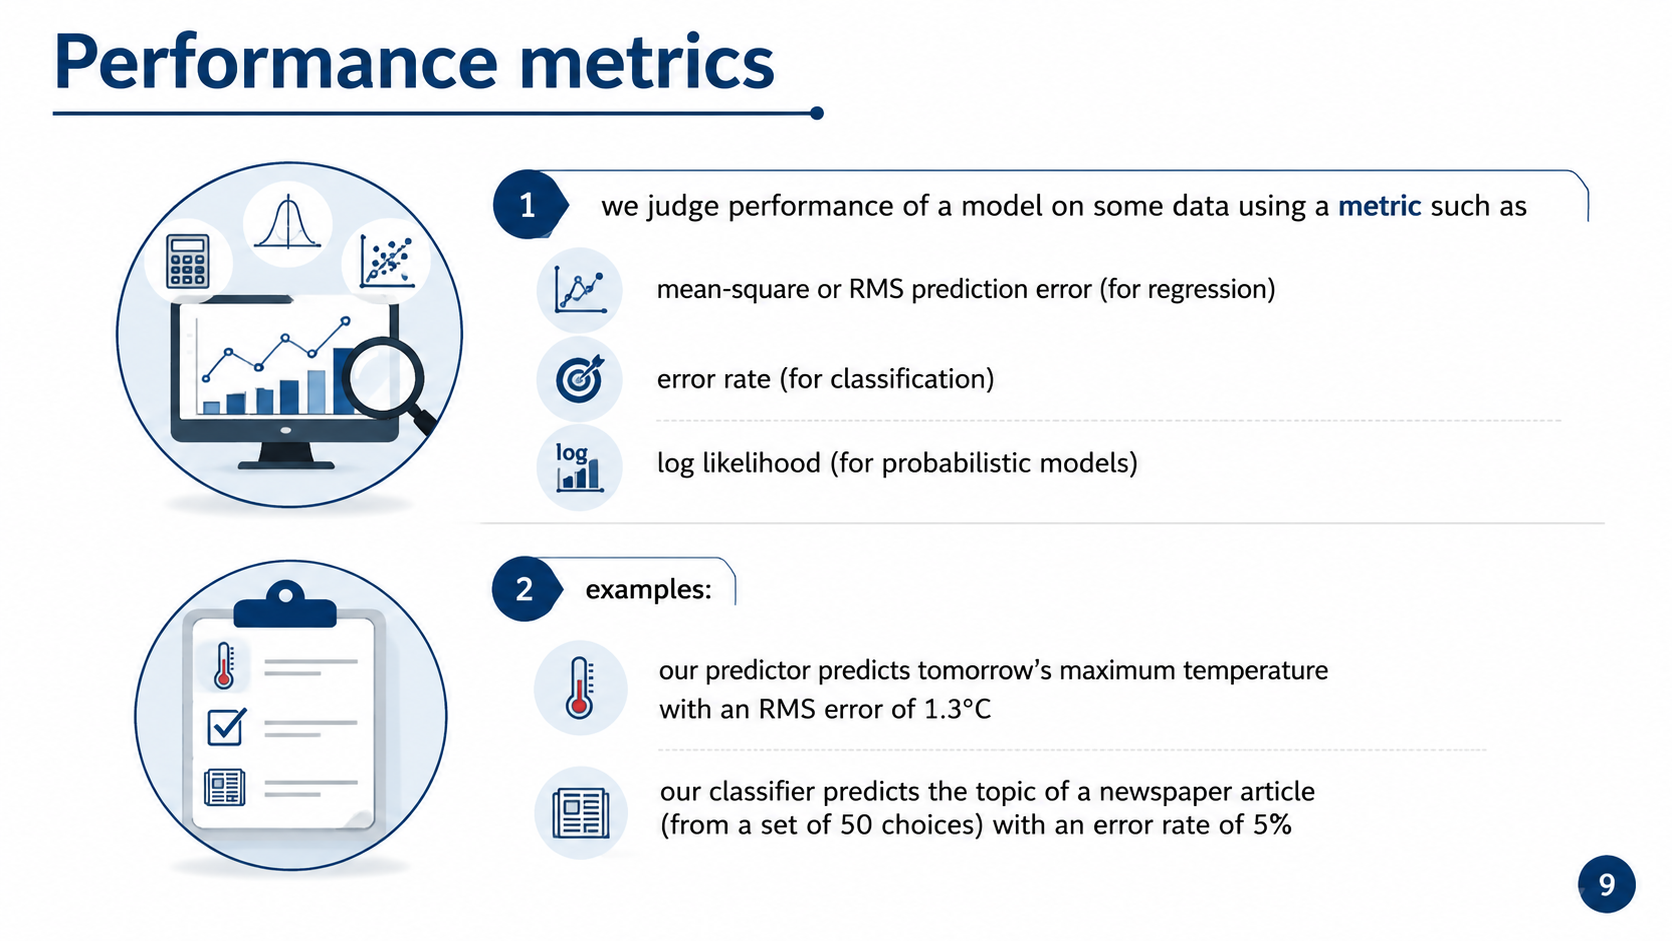
After: Redesigned slide 9 with structured metric cards
Structured metric cards with visual indicators
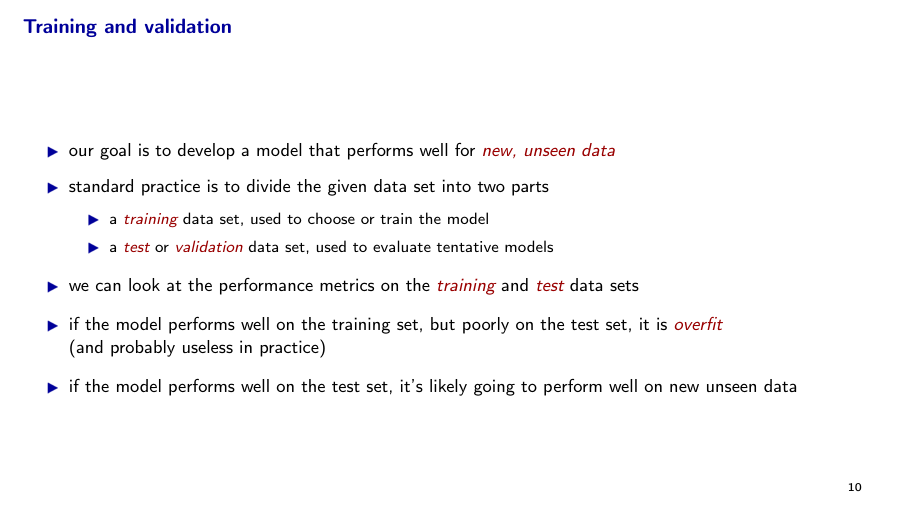
10

Training & Validation — Data-Split Flowchart with Overfit Outcome

Train/test split and overfitting explained in prose bullets. The redesign creates a data-split flowchart (70–80% training, 20–30% validation) with overfit vs. success outcome panels.

Before
Before: Original slide 10 — prose bullets on training and validation
Prose bullets, no data-split diagram or outcome comparison
After
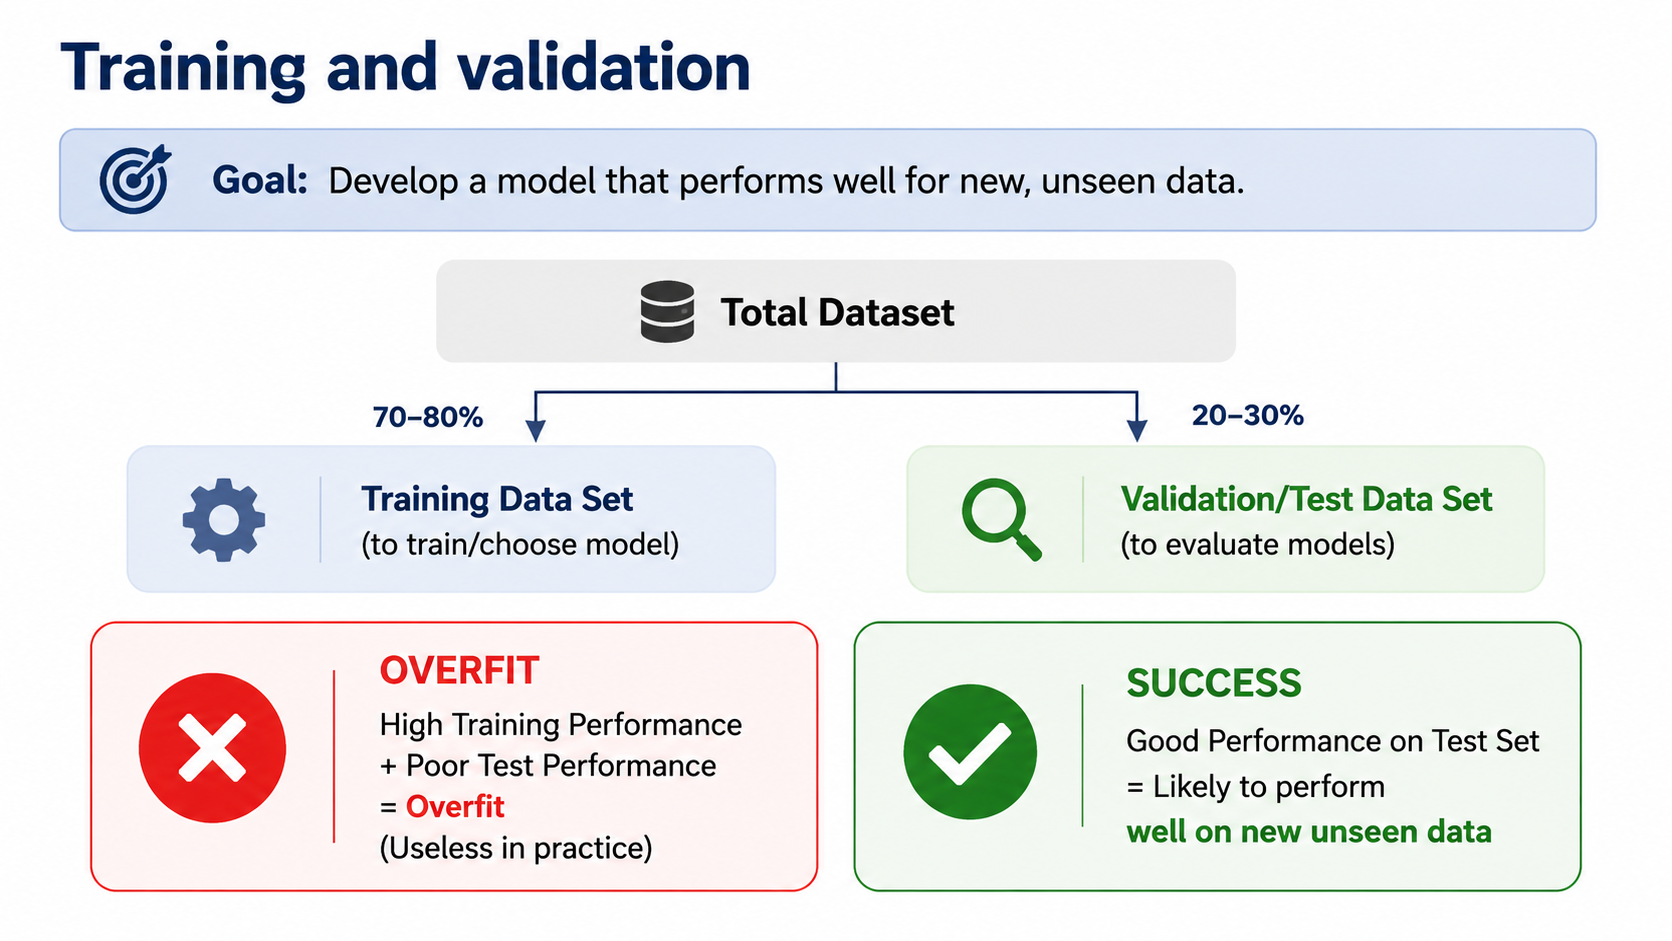
After: Redesigned slide 10 with train/test flowchart and overfit panels
Data-split flowchart with overfit vs success outcome panels
11

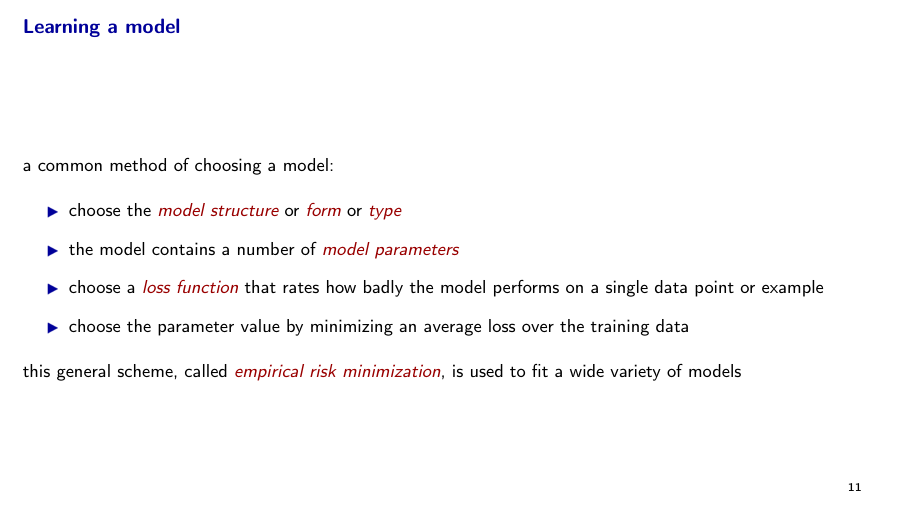
Learning a Model — Empirical Risk Minimization Pipeline

Four-step model selection described as a bullet chain ending in "empirical risk minimization." The redesign creates a numbered 4-step pipeline with concept icons and a summary callout.

Before
Before: Original slide 11 — bullet chain for empirical risk minimization
Dense bullet chain, no step-by-step visual pipeline
After
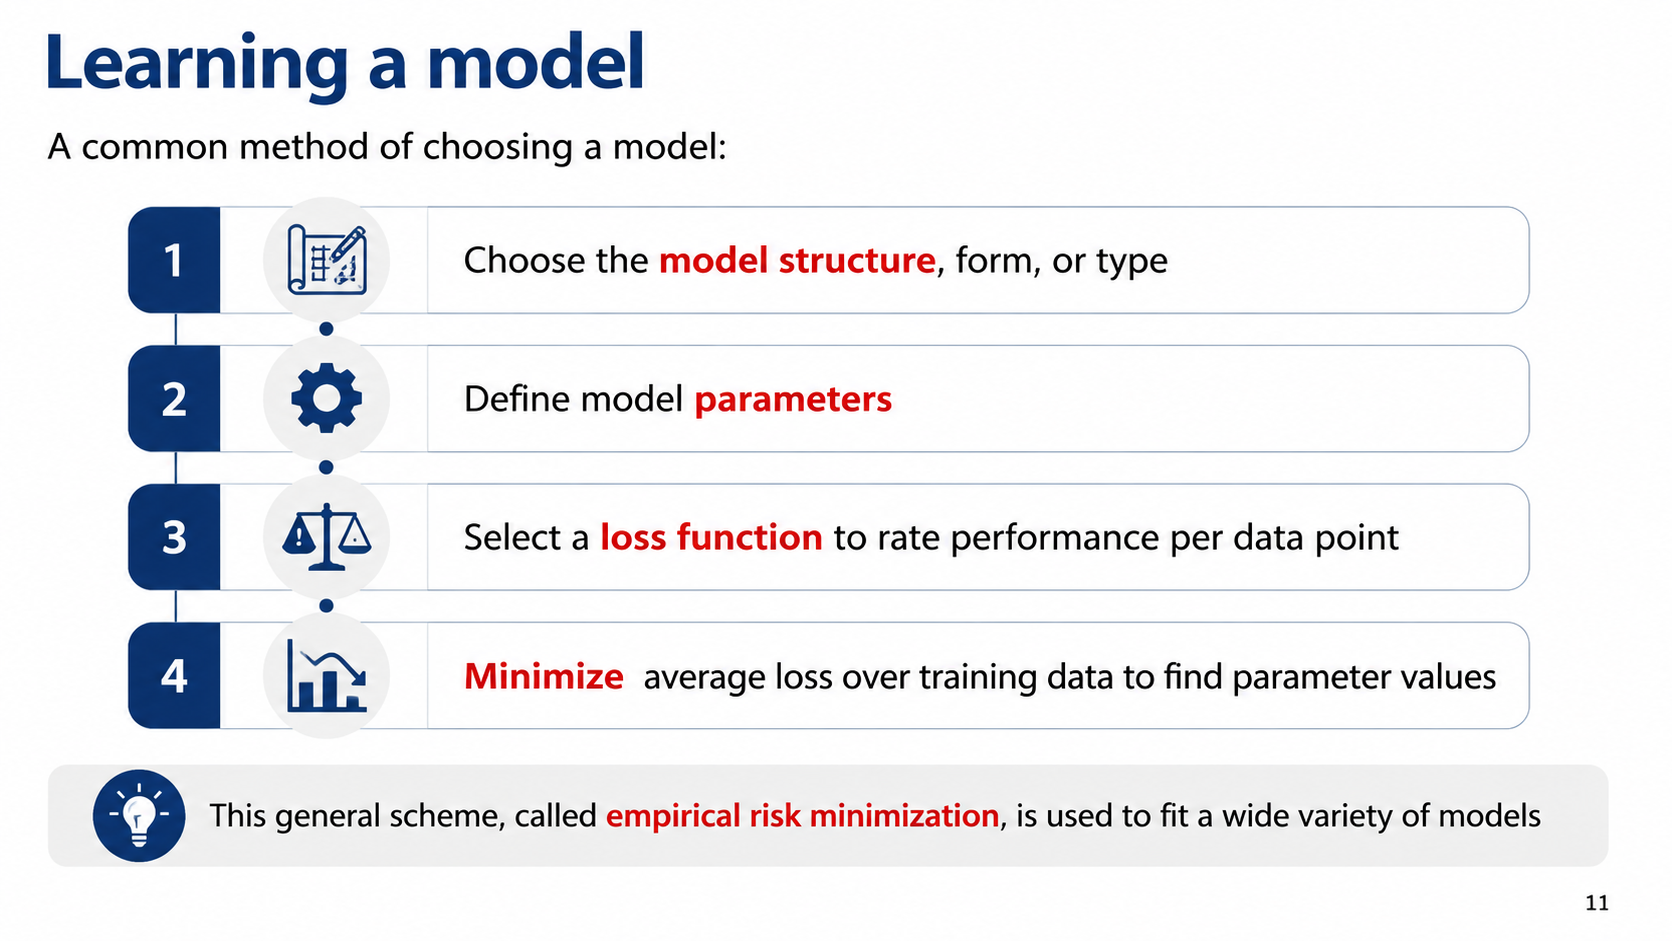
After: Redesigned slide 11 with numbered learning pipeline
Numbered 4-step pipeline with icons and ERM summary callout
12

Section Divider — Examples

Bare section title. The redesign creates a visual section break with example-themed graphics.

Before
Before: Original slide 12 — bare Examples section title
Single-line section divider, no visual treatment
After

After: Redesigned slide 12 with visual section divider
Visual section break with example-themed graphics
13

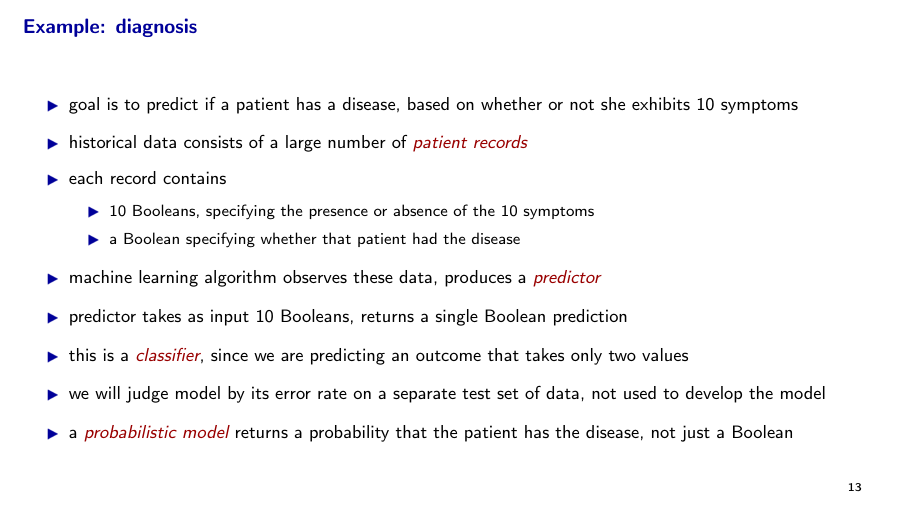
Diagnosis Example — Input → Predictor → Output Pipeline

A classifier example described as eight nested bullets. The redesign creates a three-step workflow (Goal & Data → Process → Evaluation) with a simplified input→predictor→output summary flow.

Before
Before: Original slide 13 — nested bullets on diagnosis classifier
Eight nested bullets, no data flow visualization
After
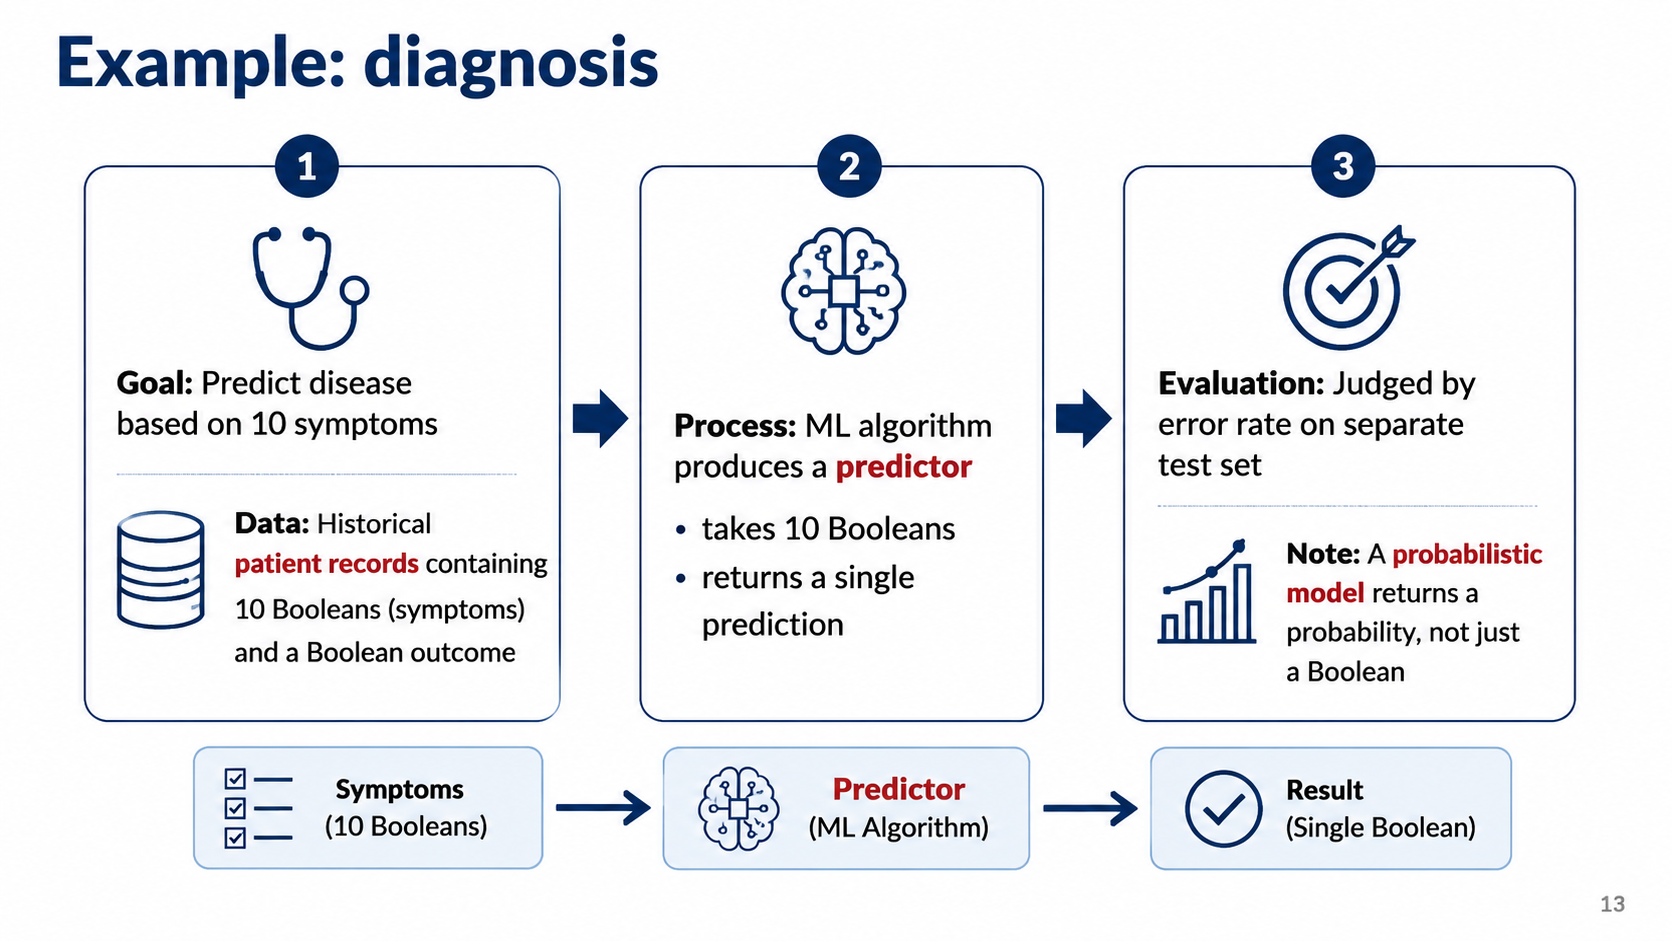
After: Redesigned slide 13 with diagnosis workflow pipeline
Three-step workflow with input→predictor→output summary flow
14

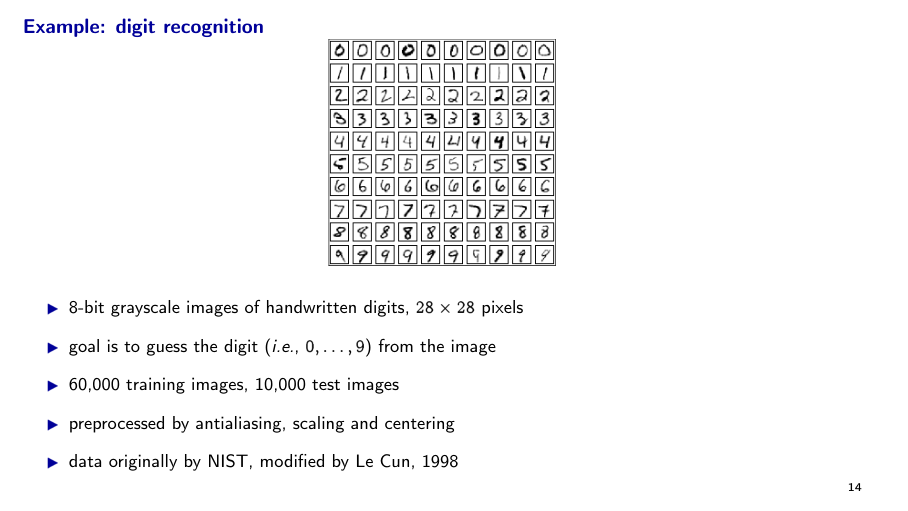
Digit Recognition — MNIST Dataset Showcase

MNIST digit grid with technical specs as bullets below. The redesign creates a two-column layout — icon-annotated specs on the left, framed digit grid on the right.

Before
Before: Original slide 14 — MNIST grid with bullets below
Digit grid with flat bullet specs underneath
After
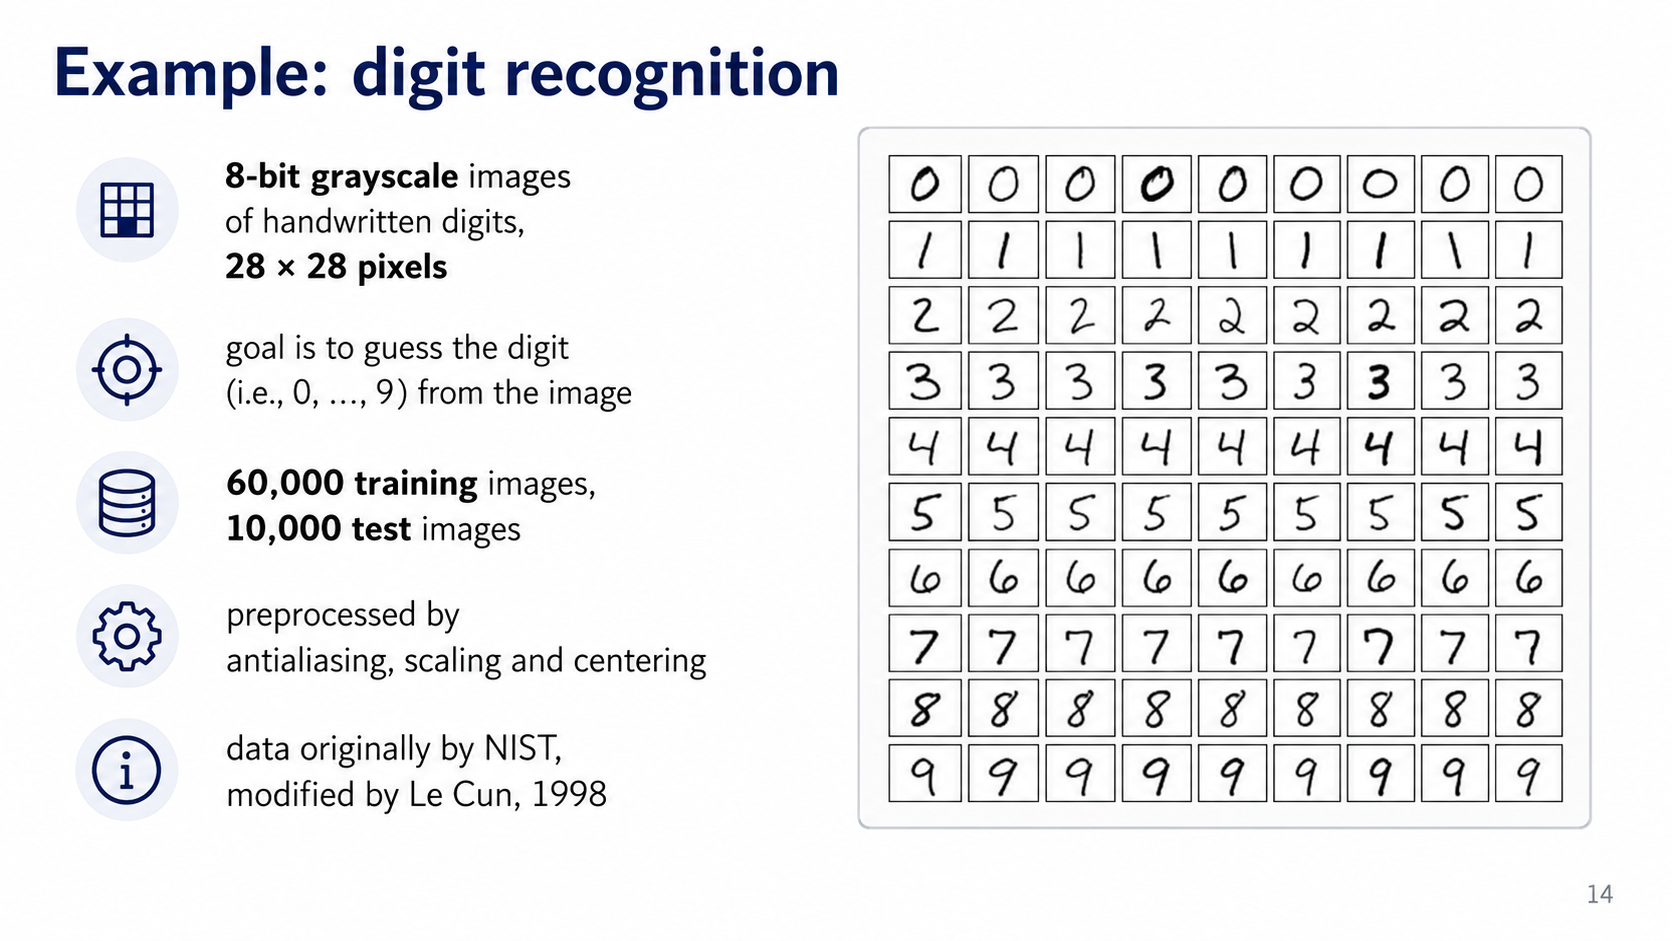
After: Redesigned slide 14 with two-column MNIST showcase
Two-column layout — icon specs left, framed digit grid right
15

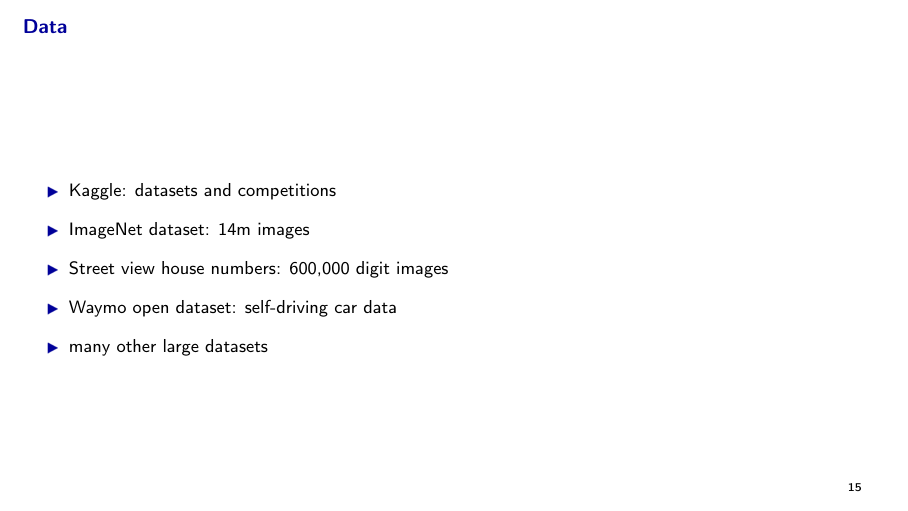
Data — ML Dataset Ecosystem

Major ML datasets listed as bullets. The redesign presents them as a dataset ecosystem card grid (Kaggle, ImageNet, SVHN, Waymo).

Before
Before: Original slide 15 — flat dataset bullet list
Flat bullet list of dataset names
After
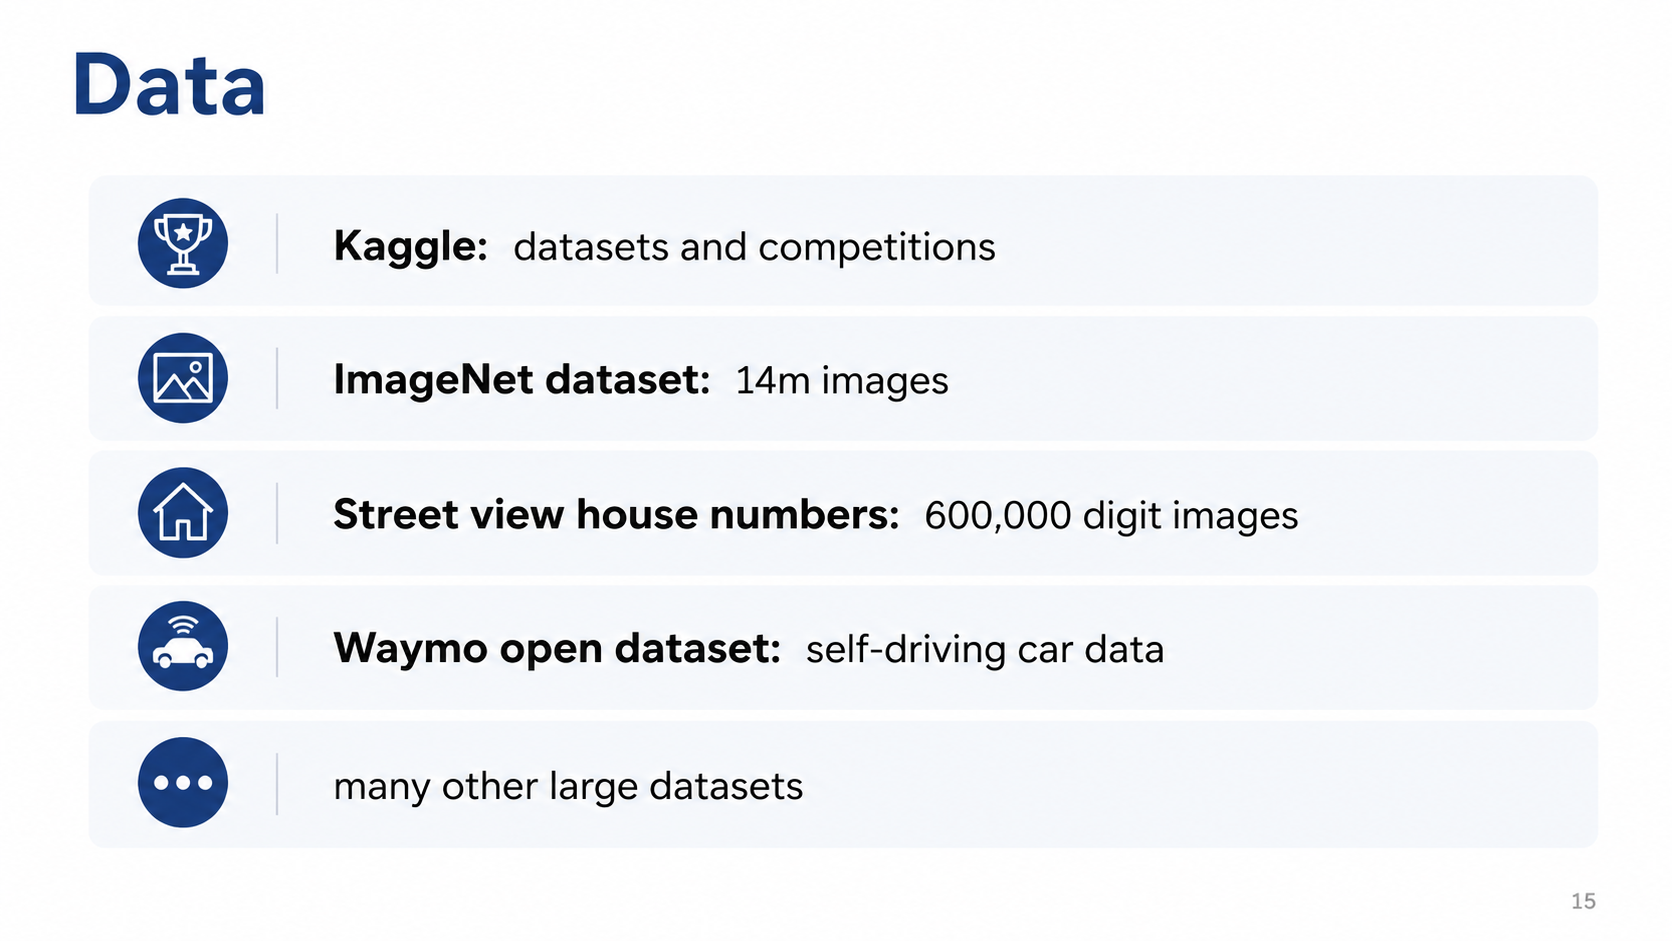
After: Redesigned slide 15 with dataset ecosystem cards
Dataset ecosystem card grid with visual categorization
16

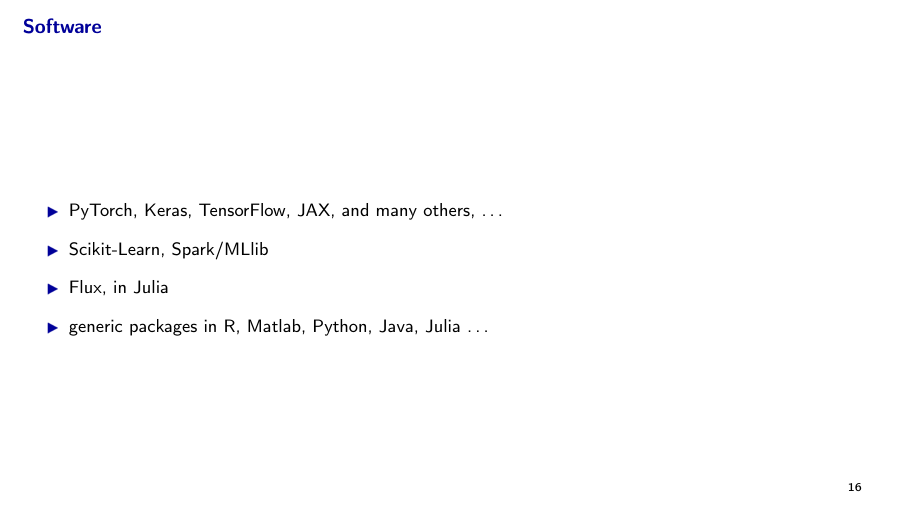
Software — ML Framework Logo Ecosystem Grid

ML frameworks listed as four ungrouped bullets. The redesign creates a 2×2 logo grid — PyTorch/TensorFlow, Scikit-Learn/Spark, Flux/Julia, and multi-language packages.

Before
Before: Original slide 16 — flat software bullet list
Four ungrouped bullets, no framework logos
After
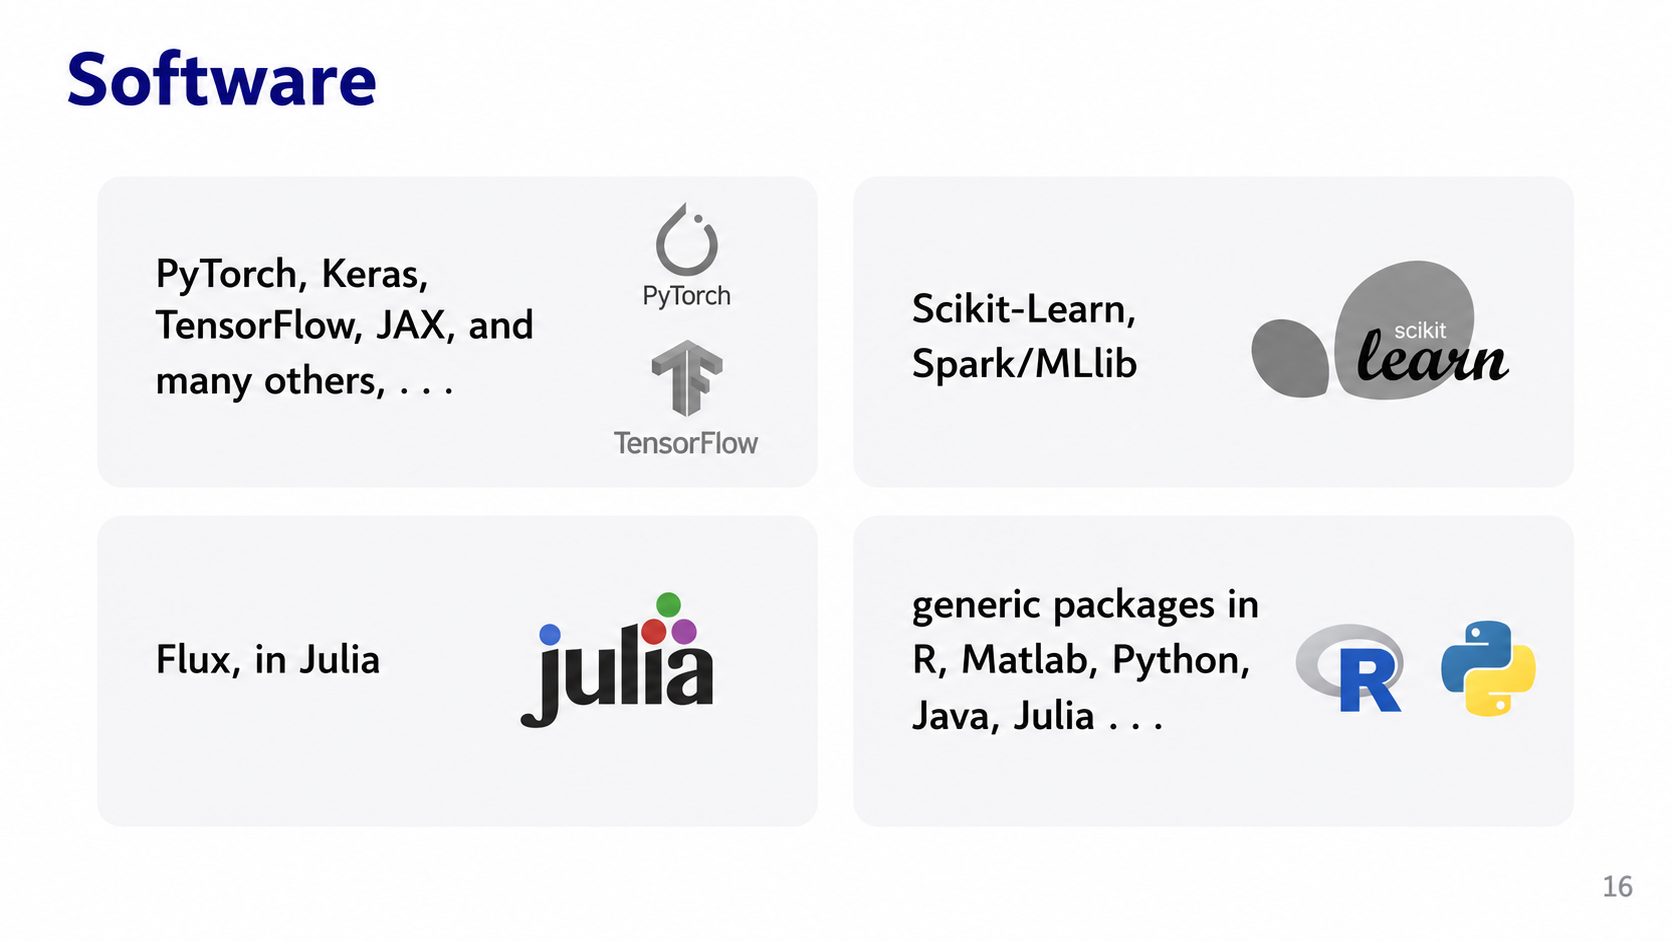
After: Redesigned slide 16 with ML framework logo grid
2×2 logo grid grouping frameworks by ecosystem family
17

Section Divider — Course Outline

Bare section title. The redesign creates a visual course-outline section break.

Before
Before: Original slide 17 — bare Course Outline section title
Single-line section divider
After
After: Redesigned slide 17 with visual course outline divider
Visual section break for course outline
18

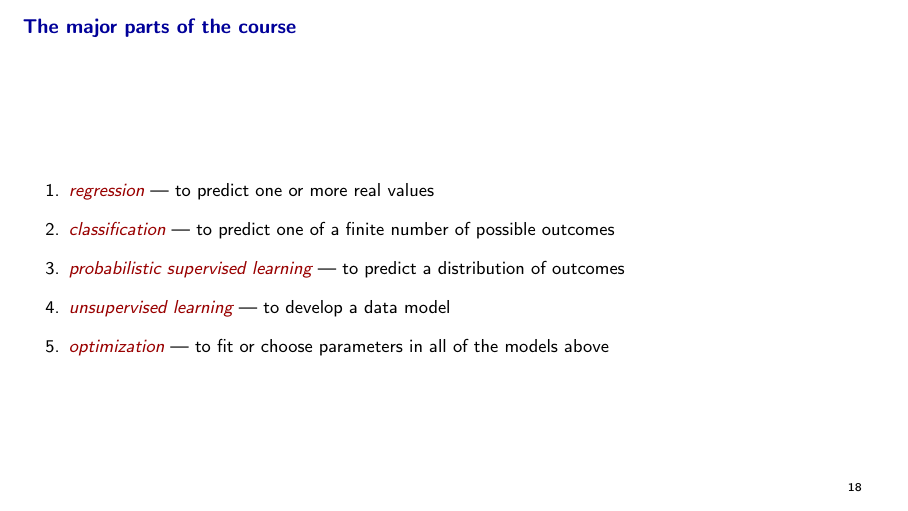
Course Roadmap — Curriculum Concept Cards

Five course topics as a numbered list with italic terms. The redesign creates icon-coded curriculum cards — regression, classification, probabilistic learning, unsupervised learning, and optimization.

Before
Before: Original slide 18 — numbered course topic list
Numbered list with italic terms, no visual roadmap
After
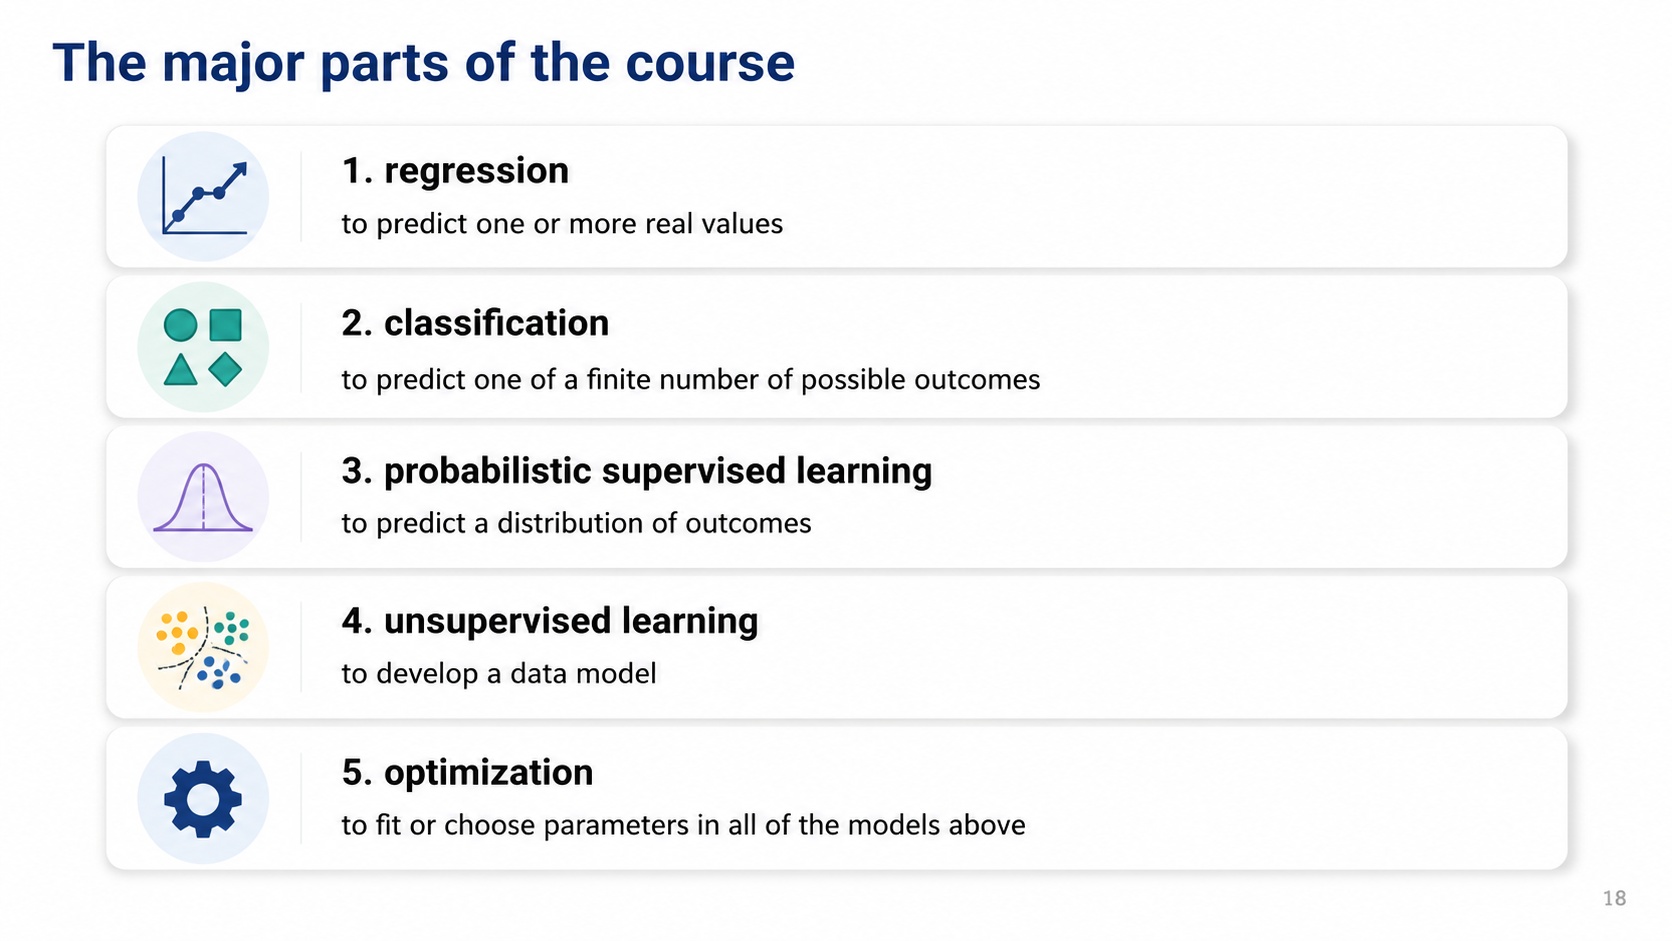
After: Redesigned slide 18 with curriculum concept cards
Icon-coded curriculum roadmap cards for each course module

Transform Your Lecture Slides in Minutes

Upload your deck, pick a style, and let Arty handle the rest. Your words stay — the design levels up.

Try Deckly.art Free