AI Medical Illustration — Case Study

AI-Generated Medical Illustrations: Immunology Lecture Redesign

A real 37-slide immunology lecture from the University of Pécs (Hungary) — generic diagrams and dense text transformed into precise, AI-generated medical illustrations of lymphoid organs, histology cross-sections, and anatomical structures by Arty.

📄 37 slides transformed 🎓 University of Pécs — Basic Immunology 🤖 Style: Medical Scientific

Why This Deck Needs a Redesign

This lecture from the University of Pécs, Department of Immunology and Biotechnology, covers the structure of lymphoid organs — bone marrow, thymus, lymph nodes, spleen, and mucosal lymphoid tissue. The content is rigorous, but the original slides suffer from significant visual problems:

Arty's redesign generates precise AI medical illustrations with consistent anatomical detail — clean organ cross-sections, labeled histology diagrams, and intuitive biological process flowcharts. Microscopy images are integrated with clear annotations, and complex immune system concepts are transformed into visual diagrams that make the biology instantly understandable.

Original lecture from the University of Pécs, Faculty of Medicine — Department of Immunology and Biotechnology. Basic Immunology: Introduction, Structure of Lymphoid Organs.
1

Title — Basic Immunology: Lymphoid Organs

Plain university title slide with course name and department info. The redesign creates a professional medical title card with an immune system illustration and cohesive visual identity.

Before
Before: Original slide 1 — plain university title slide
Plain title slide with university branding, no visual identity
After
After: Redesigned slide 1 with professional medical title and immune system illustration
Professional title card with AI-generated immune system illustration
2

Introducing the Subject 1 — Course Logistics

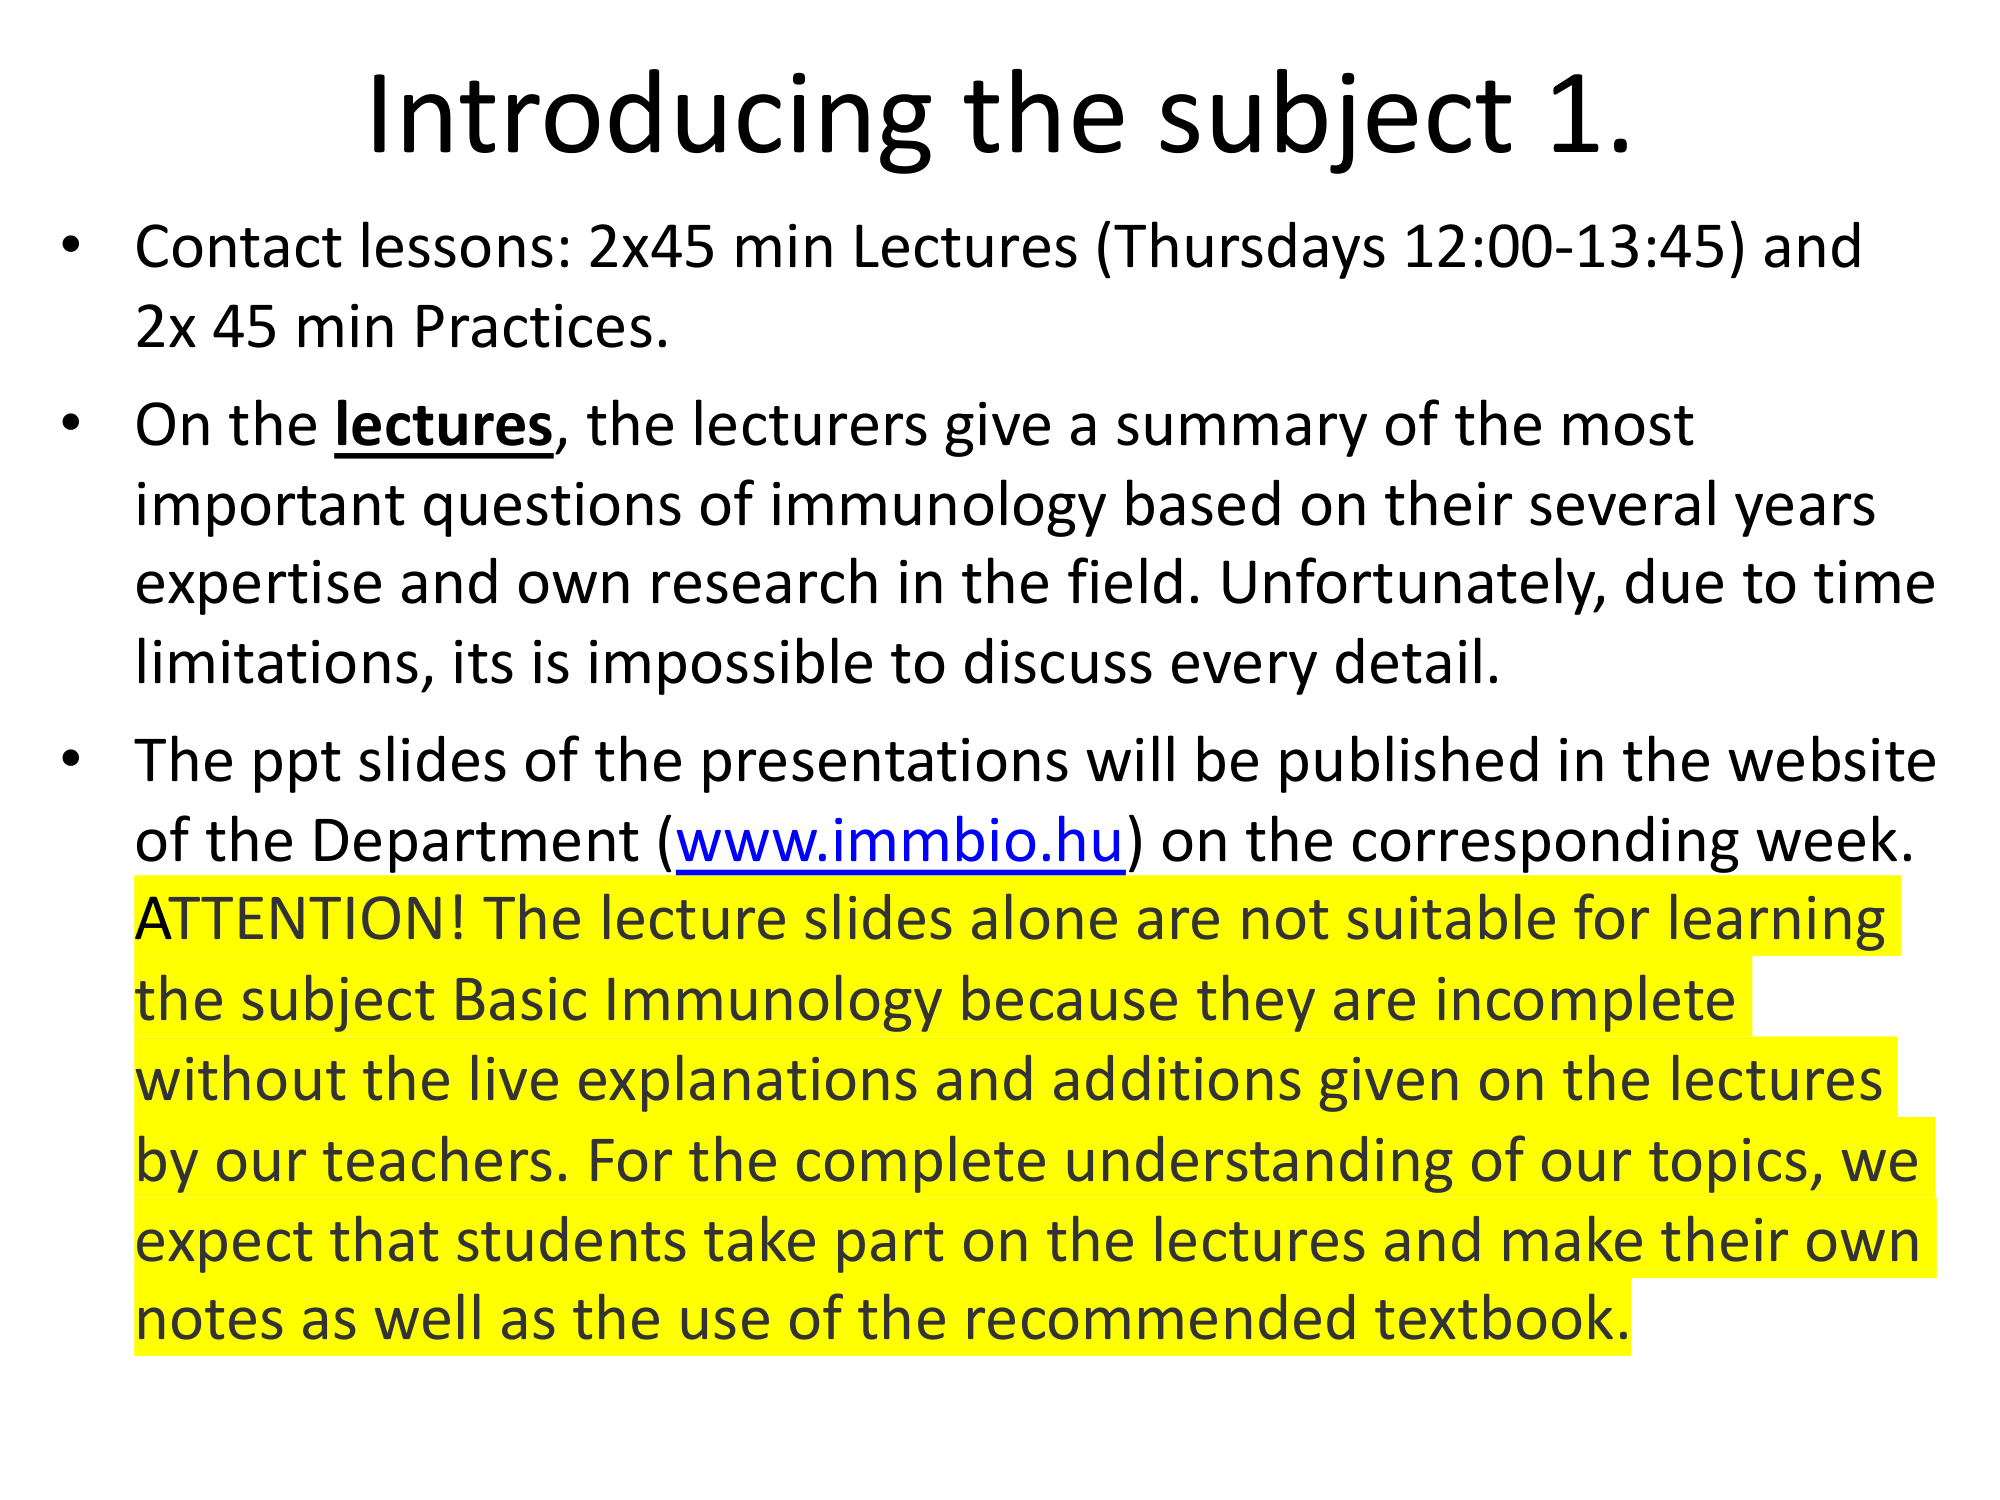
Dense text listing contact lessons, schedule info, and course structure. The redesign organizes logistics into a clean card layout with clear sections.

Before
Before: Original slide 2 — dense text course logistics
Dense text block with course logistics, no visual structure
After
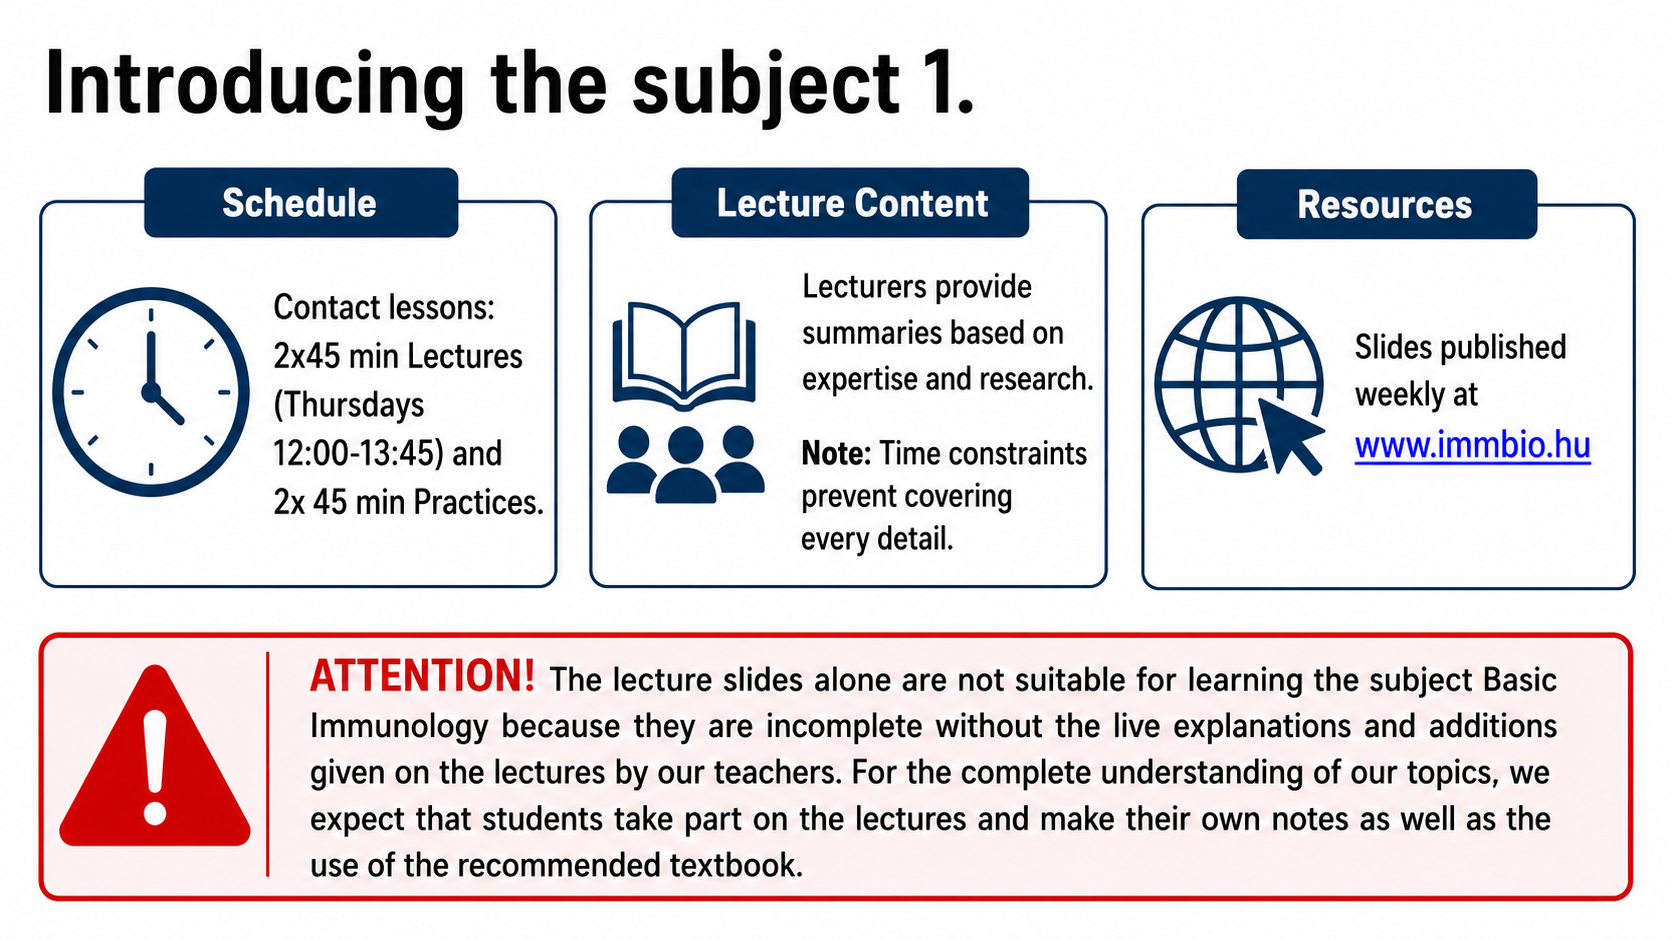
After: Redesigned slide 2 with organized logistics layout
Clean card layout organizing course logistics into scannable sections
3

Introducing the Subject 2 — Practices Overview

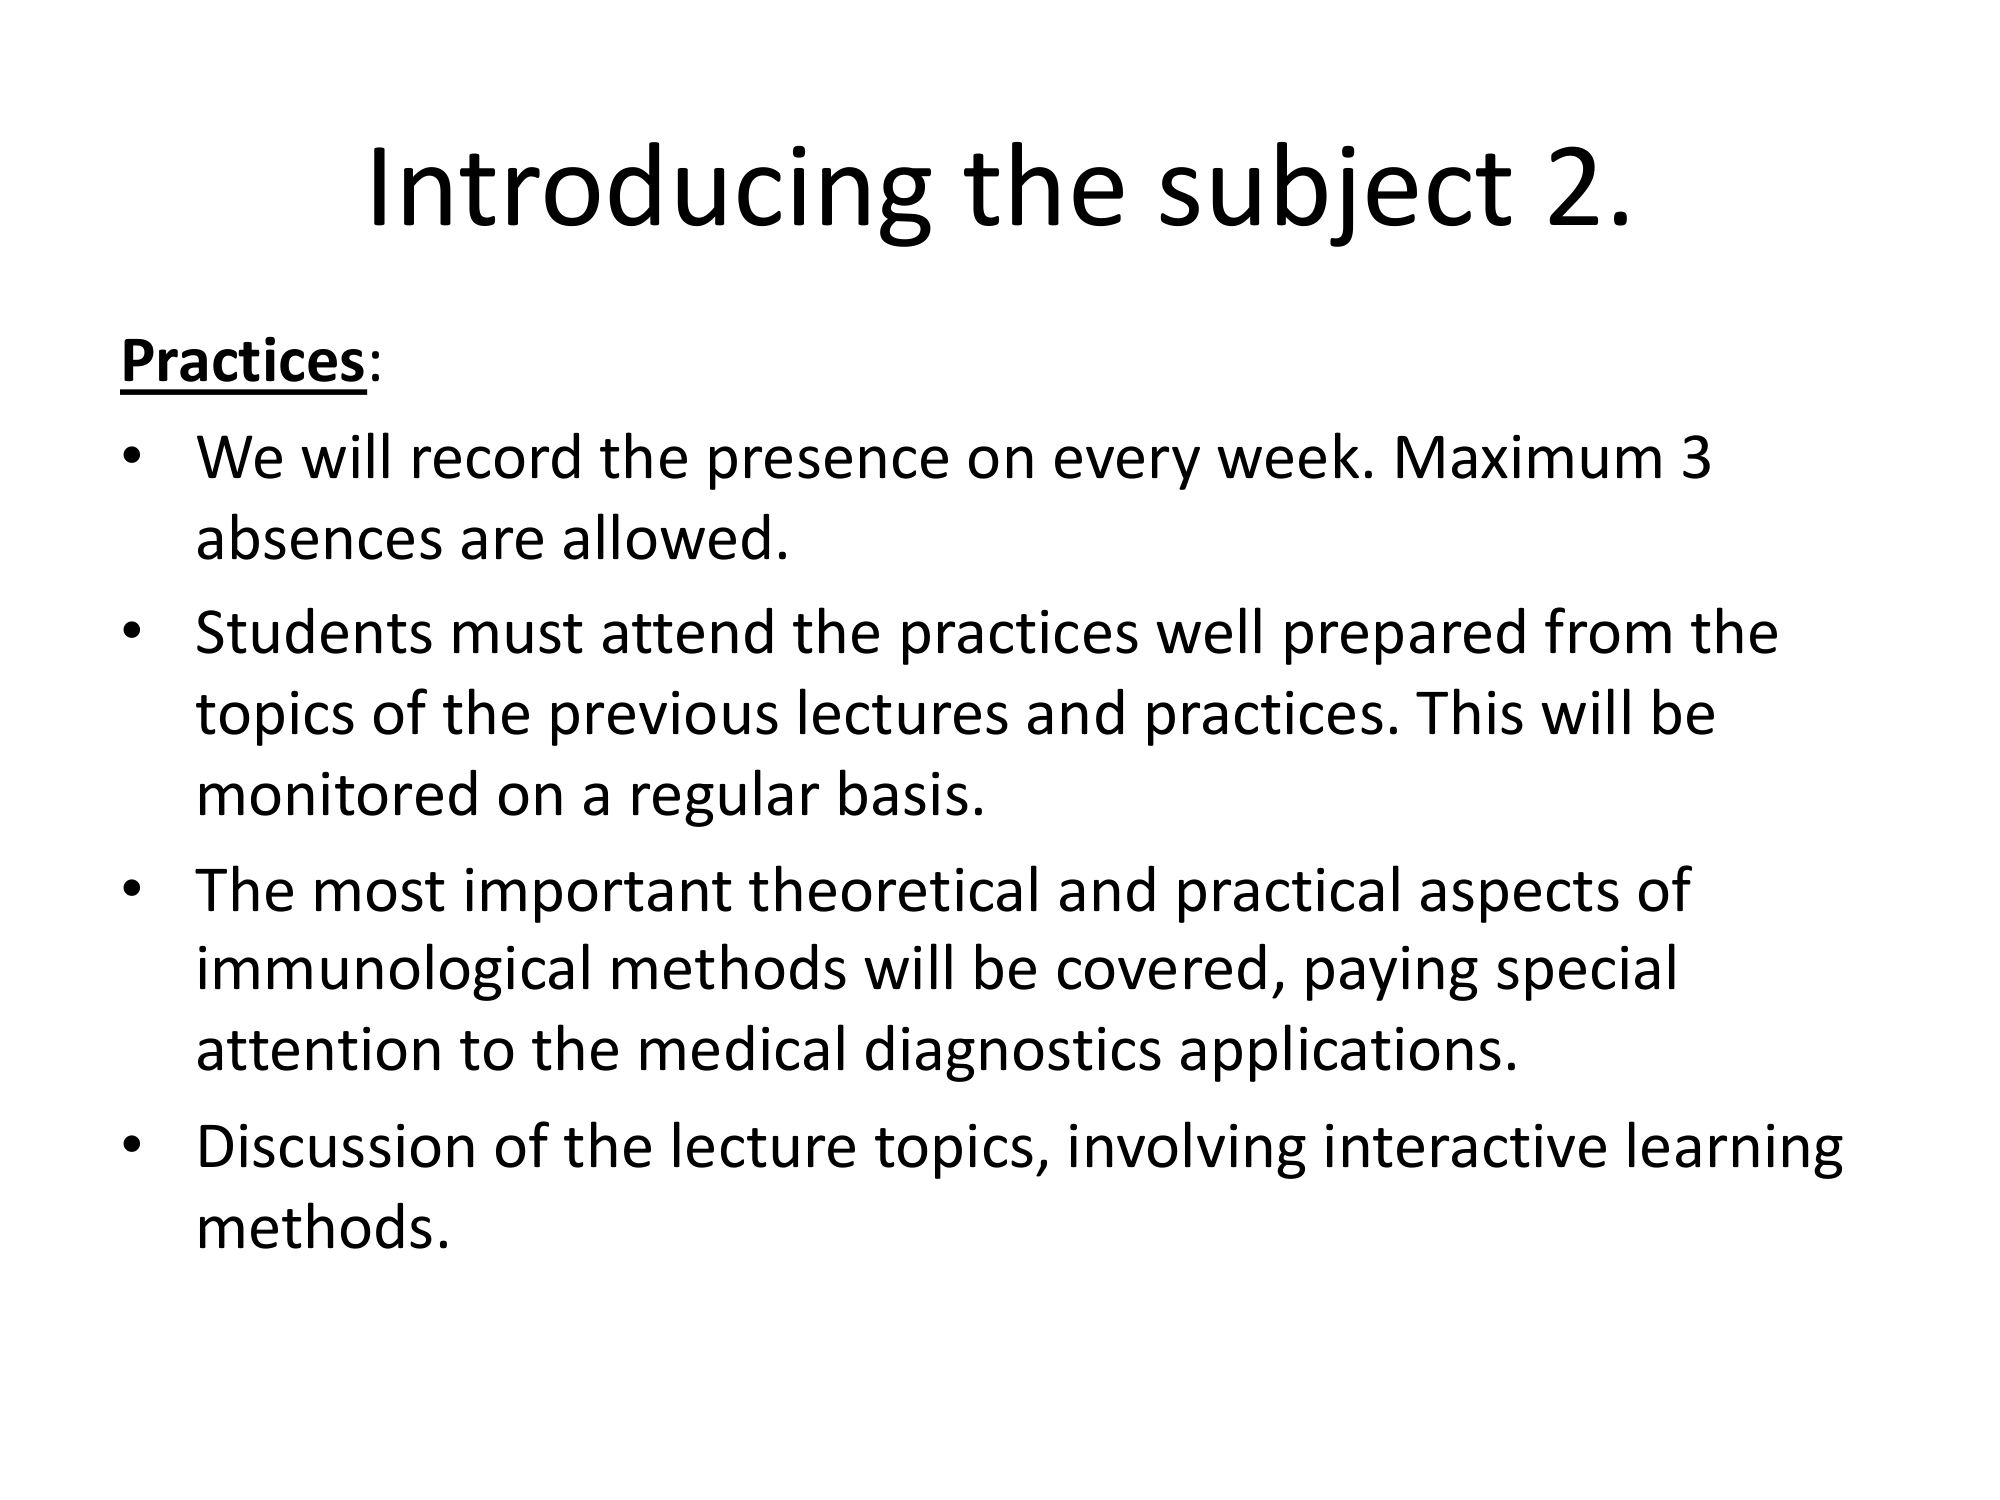
Text-heavy overview of practice sessions. The redesign presents the practice schedule in a structured, easy-to-scan format.

Before
Before: Original slide 3 — text-heavy practices overview
Wall of text listing practice sessions, flat formatting
After
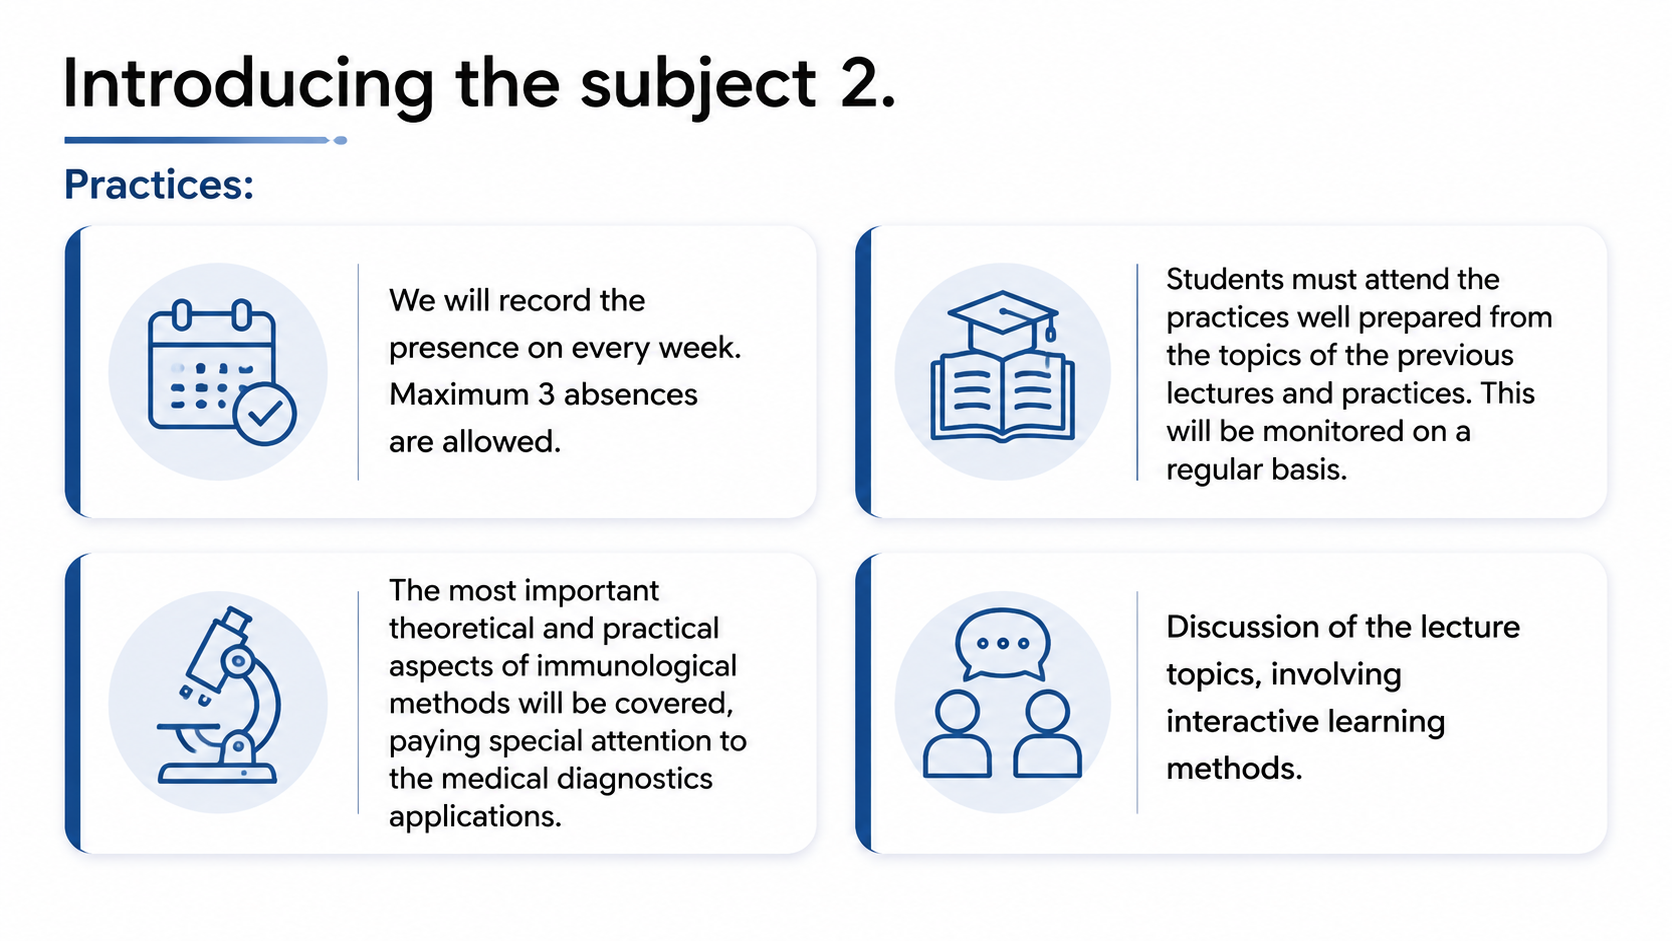
After: Redesigned slide 3 with structured practices layout
Structured schedule layout with clear visual grouping
4

Introducing the Subject 3 — Moodle Test System

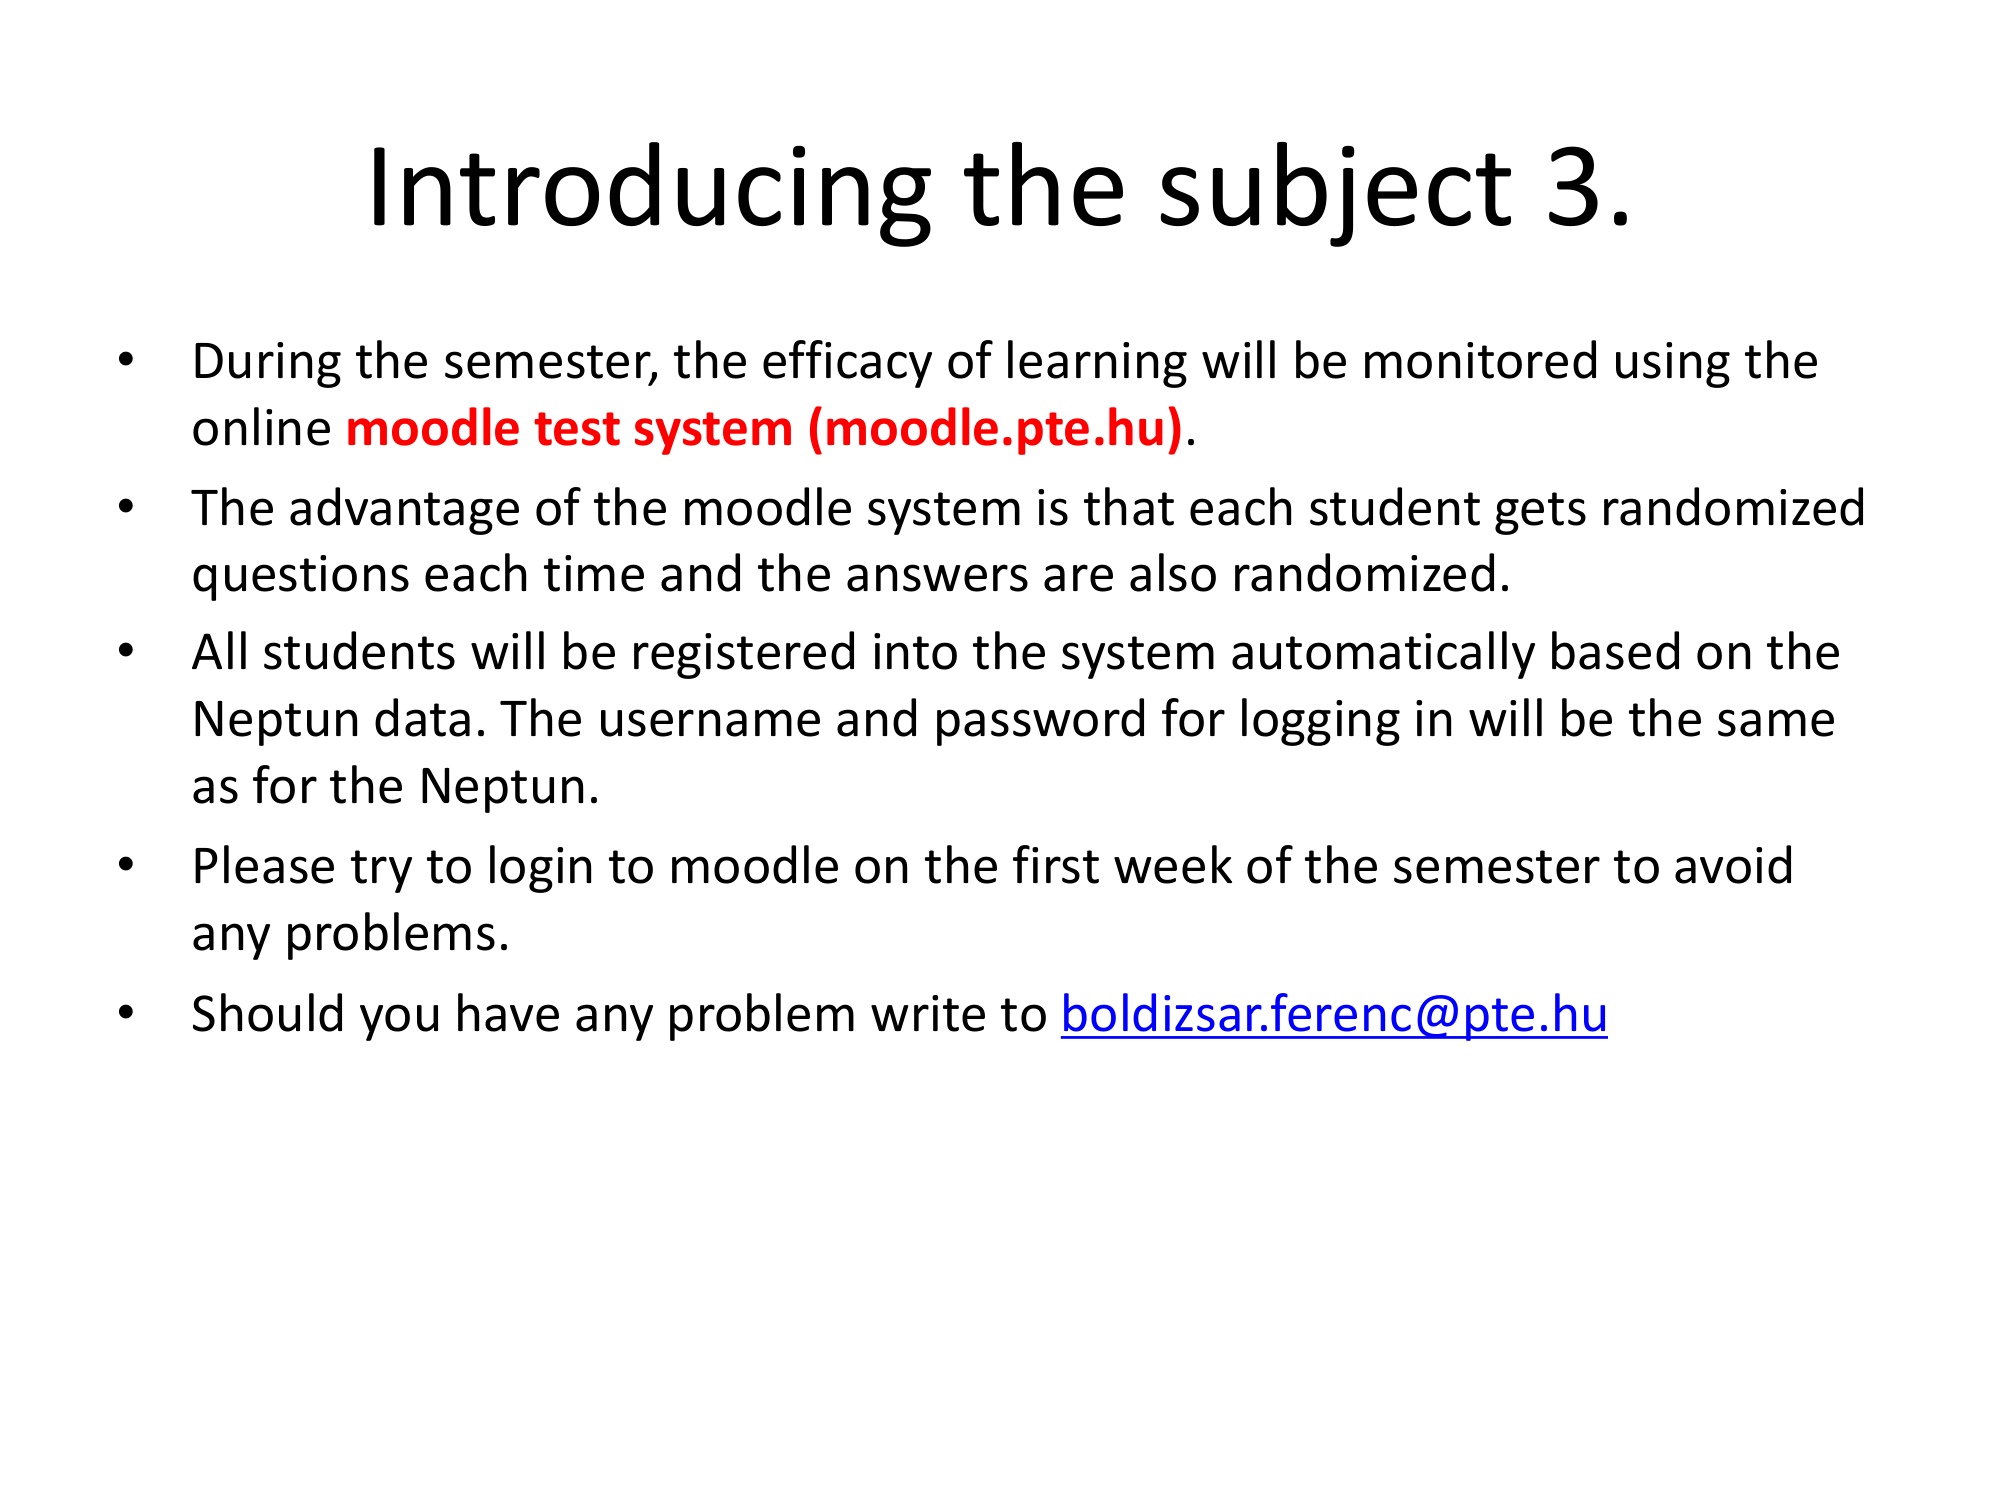
Information about the Moodle online test system. The redesign presents testing information with clean typography and visual hierarchy.

Before
Before: Original slide 4 — Moodle test system information
Plain text about Moodle testing, no visual hierarchy
After
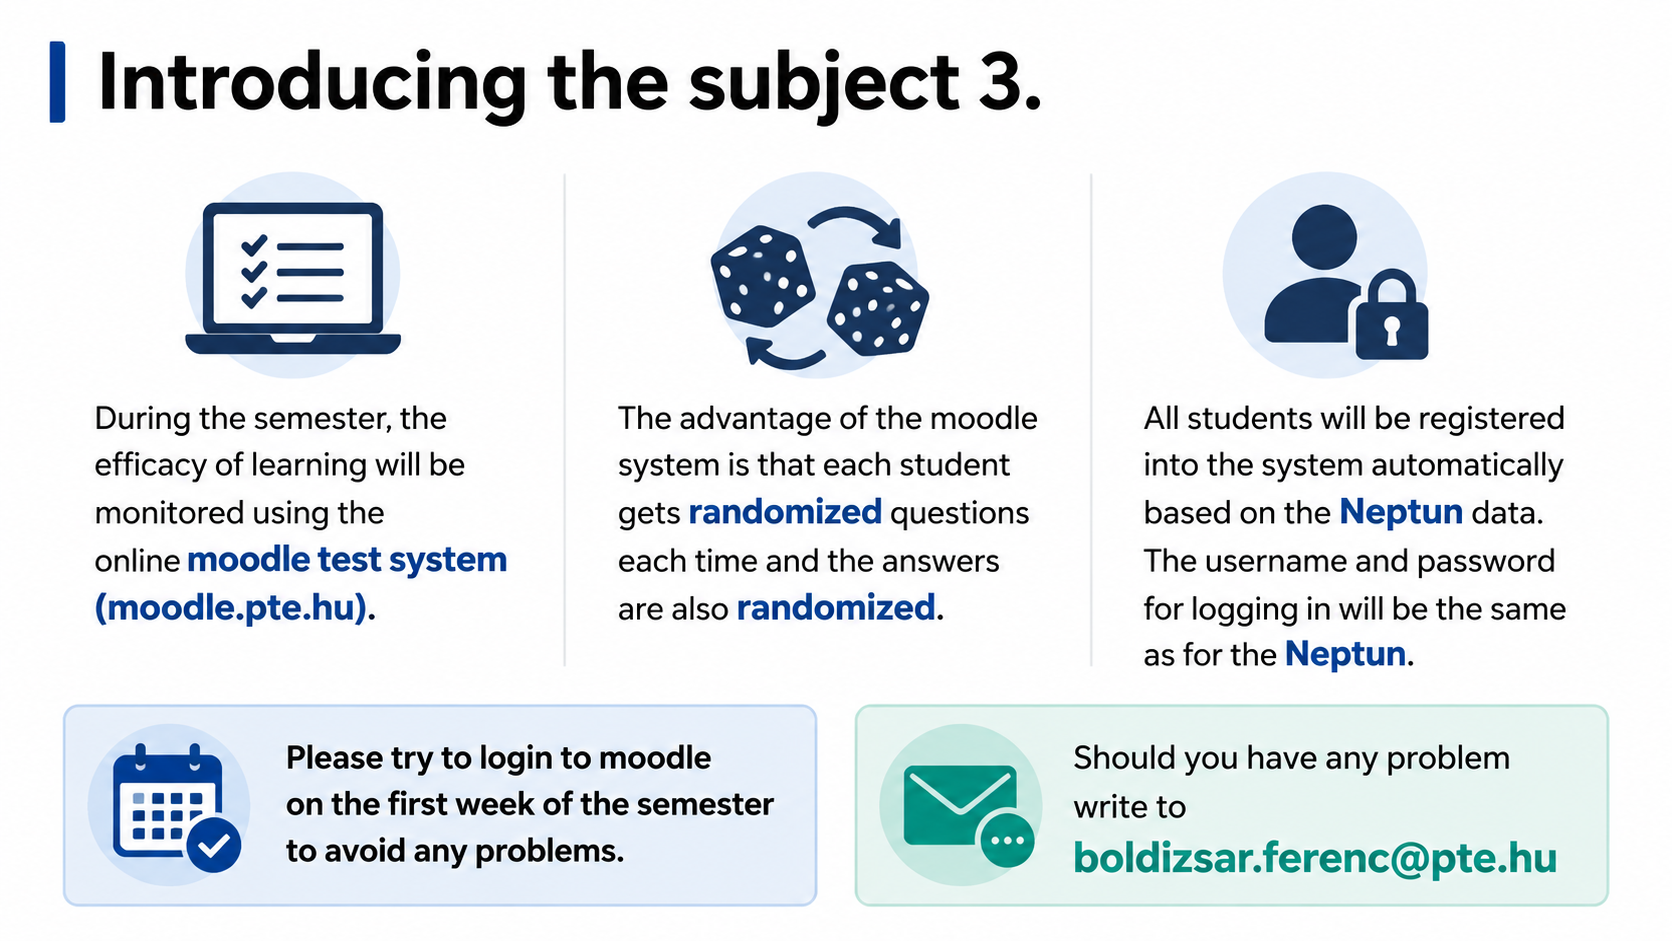
After: Redesigned slide 4 with clean test system info layout
Clean layout with structured testing information and visual cues
5

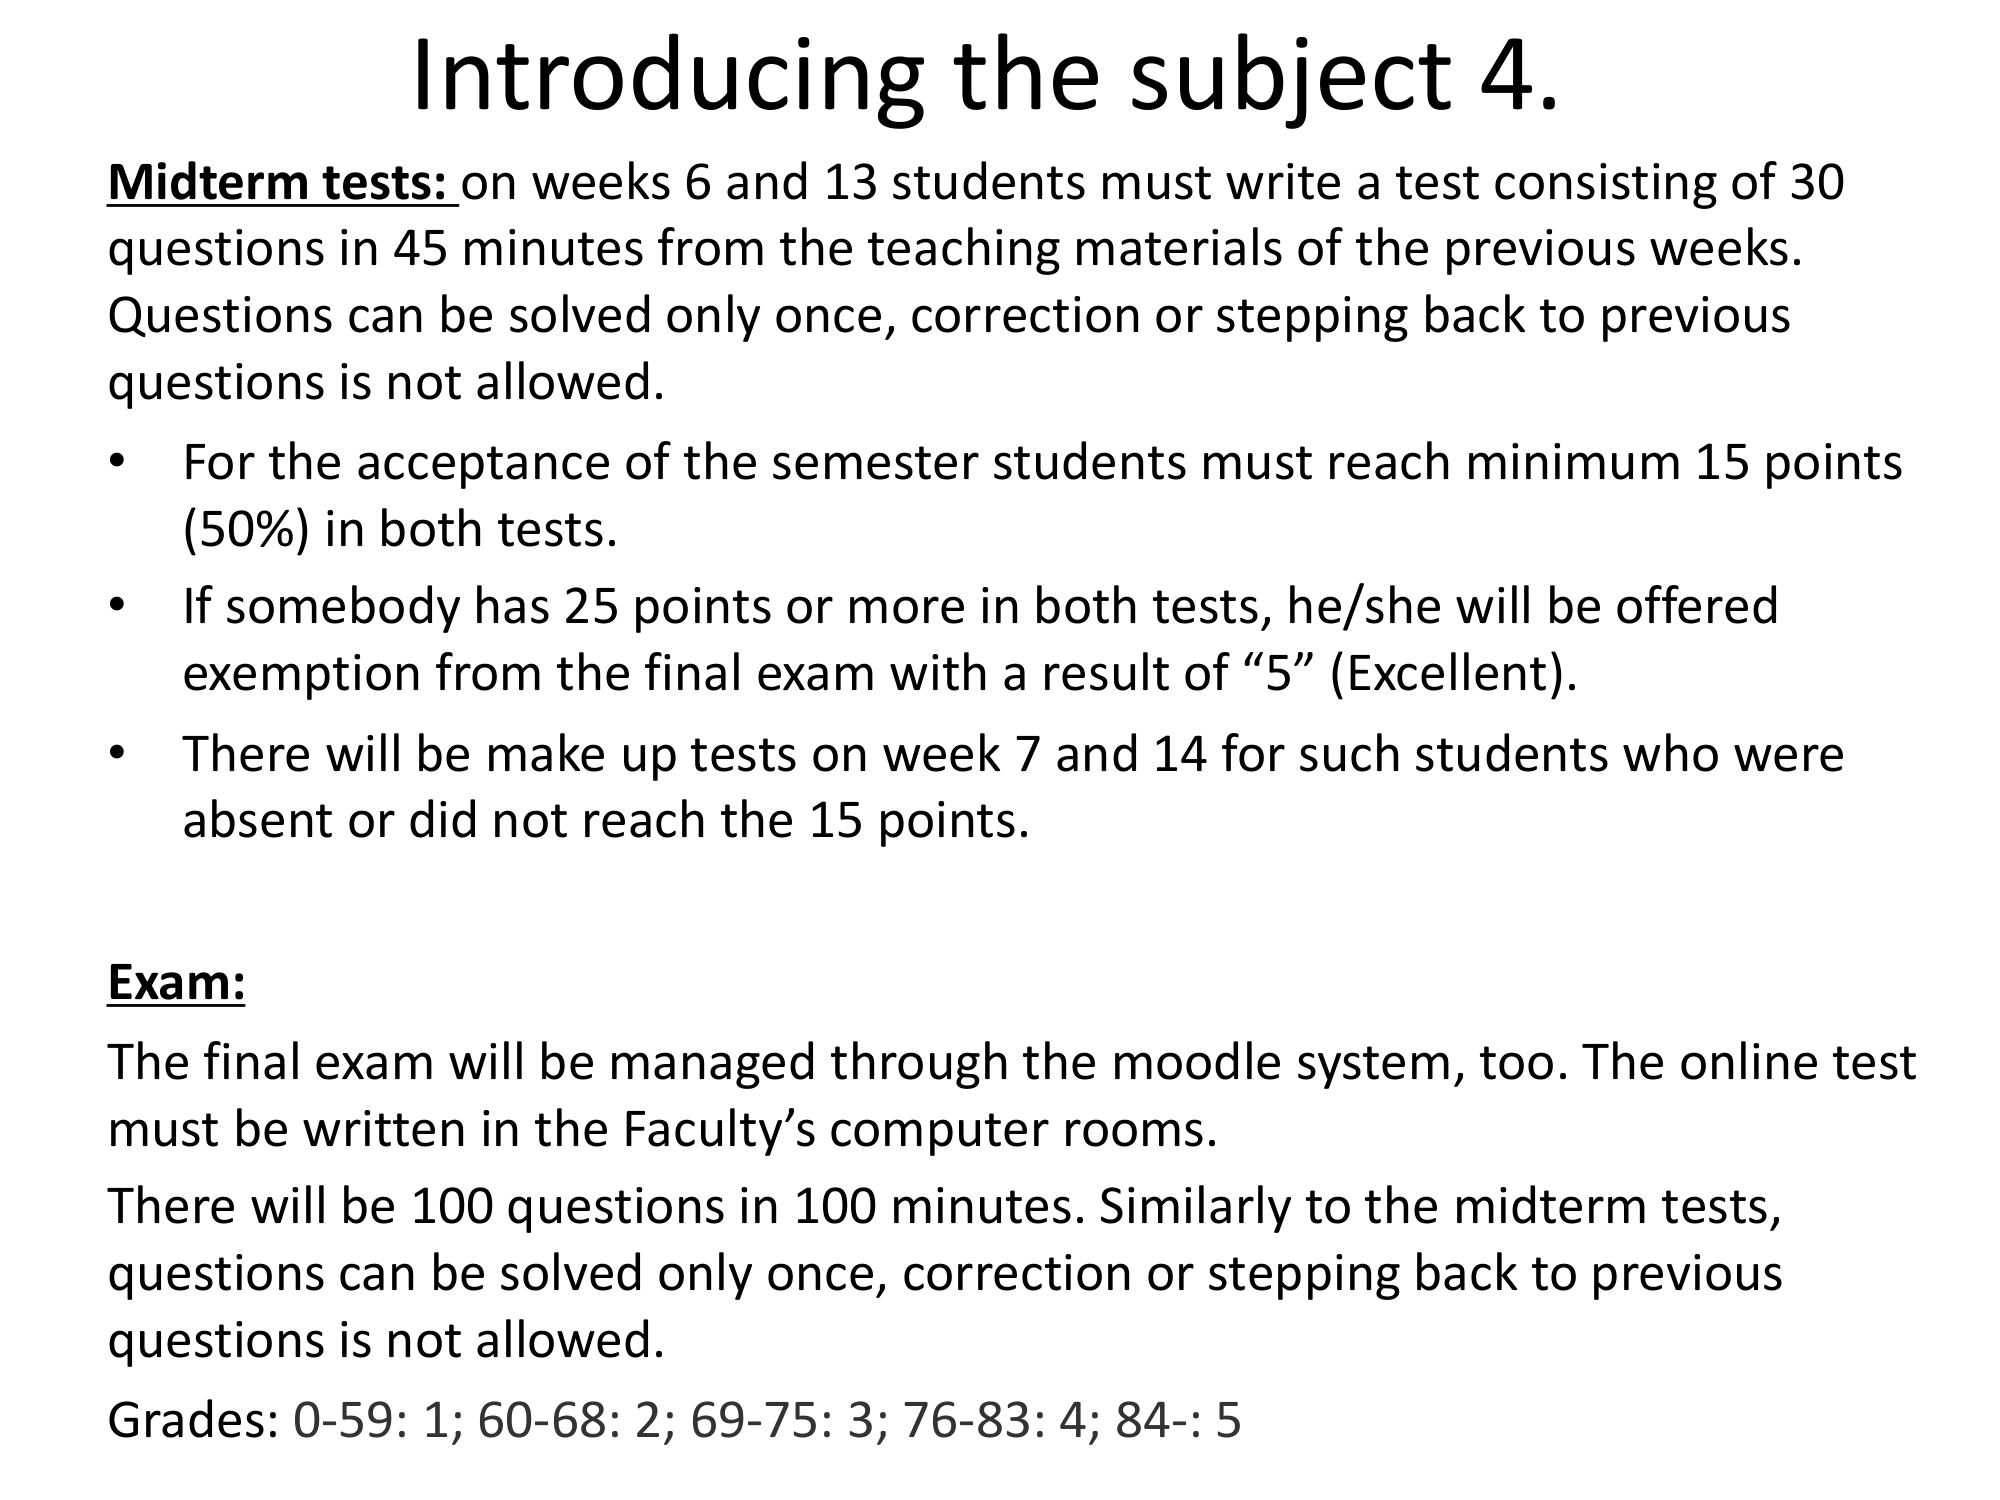
Introducing the Subject 4 — Midterm & Exam Details

Exam and midterm details in dense paragraph form. The redesign highlights key dates and requirements in a structured card format.

Before
Before: Original slide 5 — dense exam details text
Dense paragraph of exam and midterm details
After
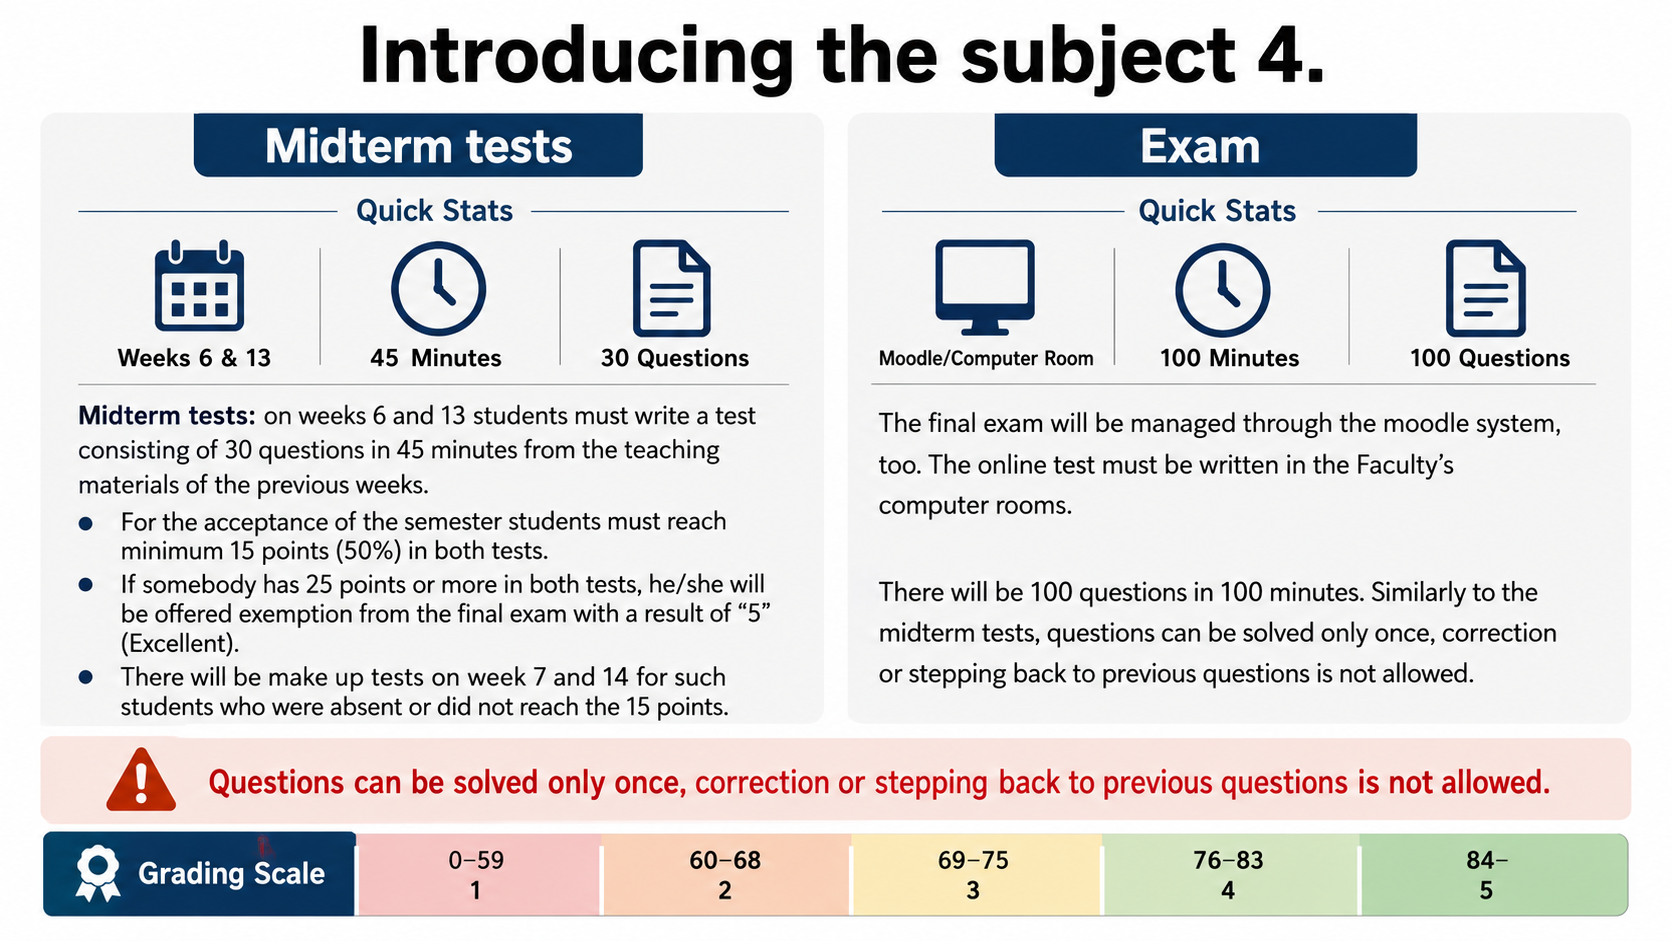
After: Redesigned slide 5 with structured exam info cards
Structured cards highlighting key dates and exam requirements
6

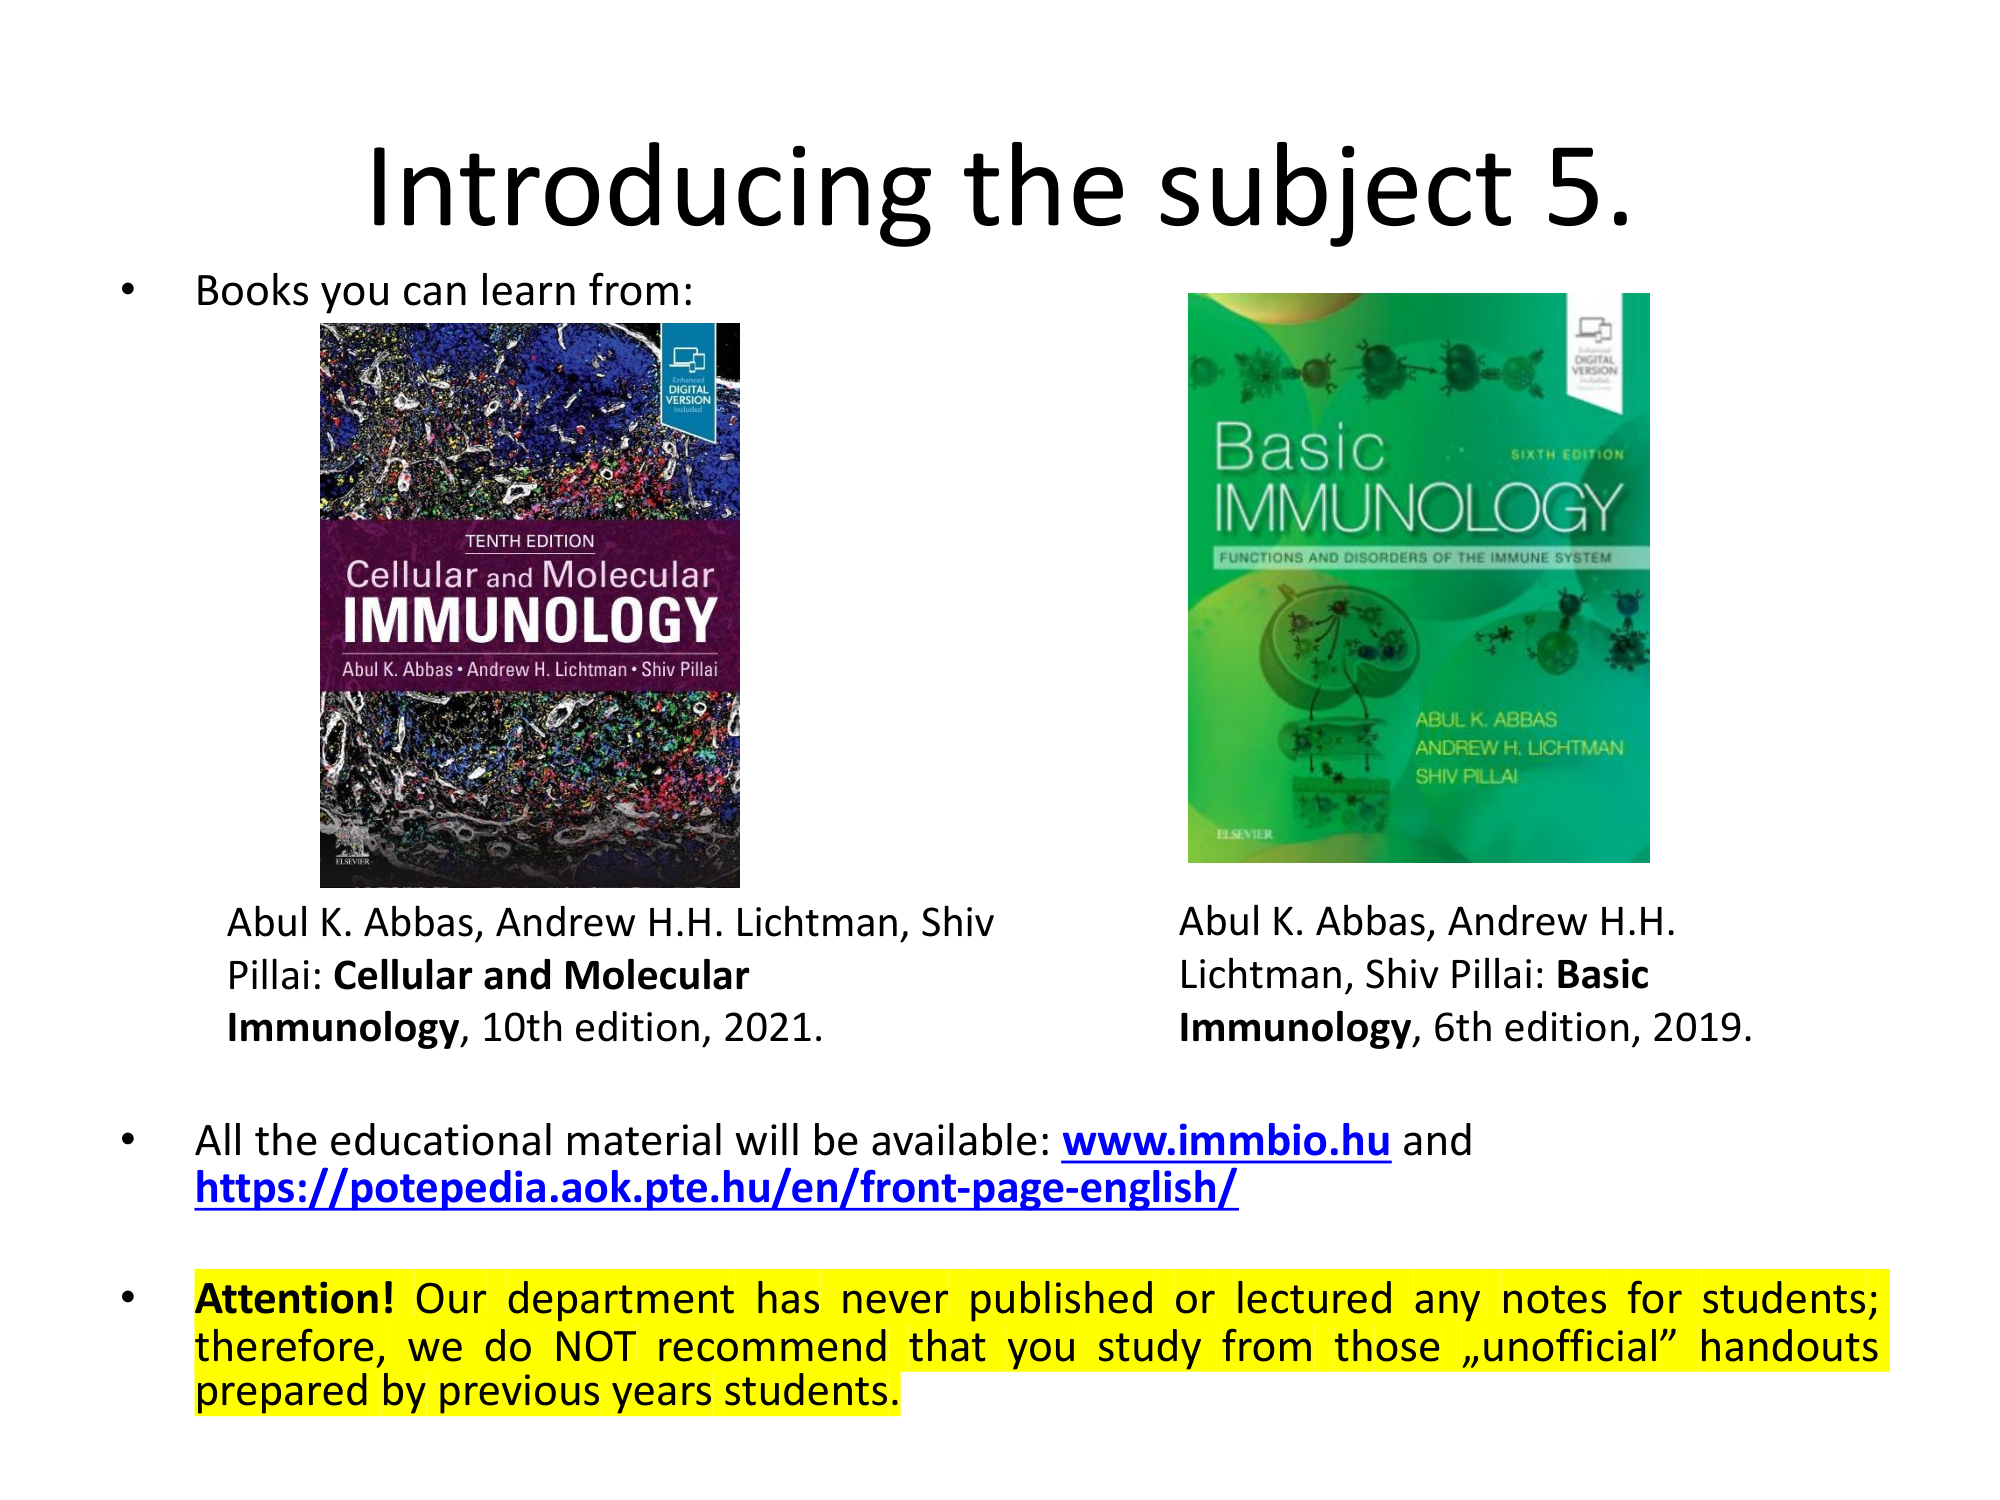
Introducing the Subject 5 — Textbook Recommendations

List of recommended textbooks including Abbas immunology textbook. The redesign presents book recommendations with clean typography and visual book cards.

Before
Before: Original slide 6 — plain textbook list
Plain text list of textbook recommendations
After
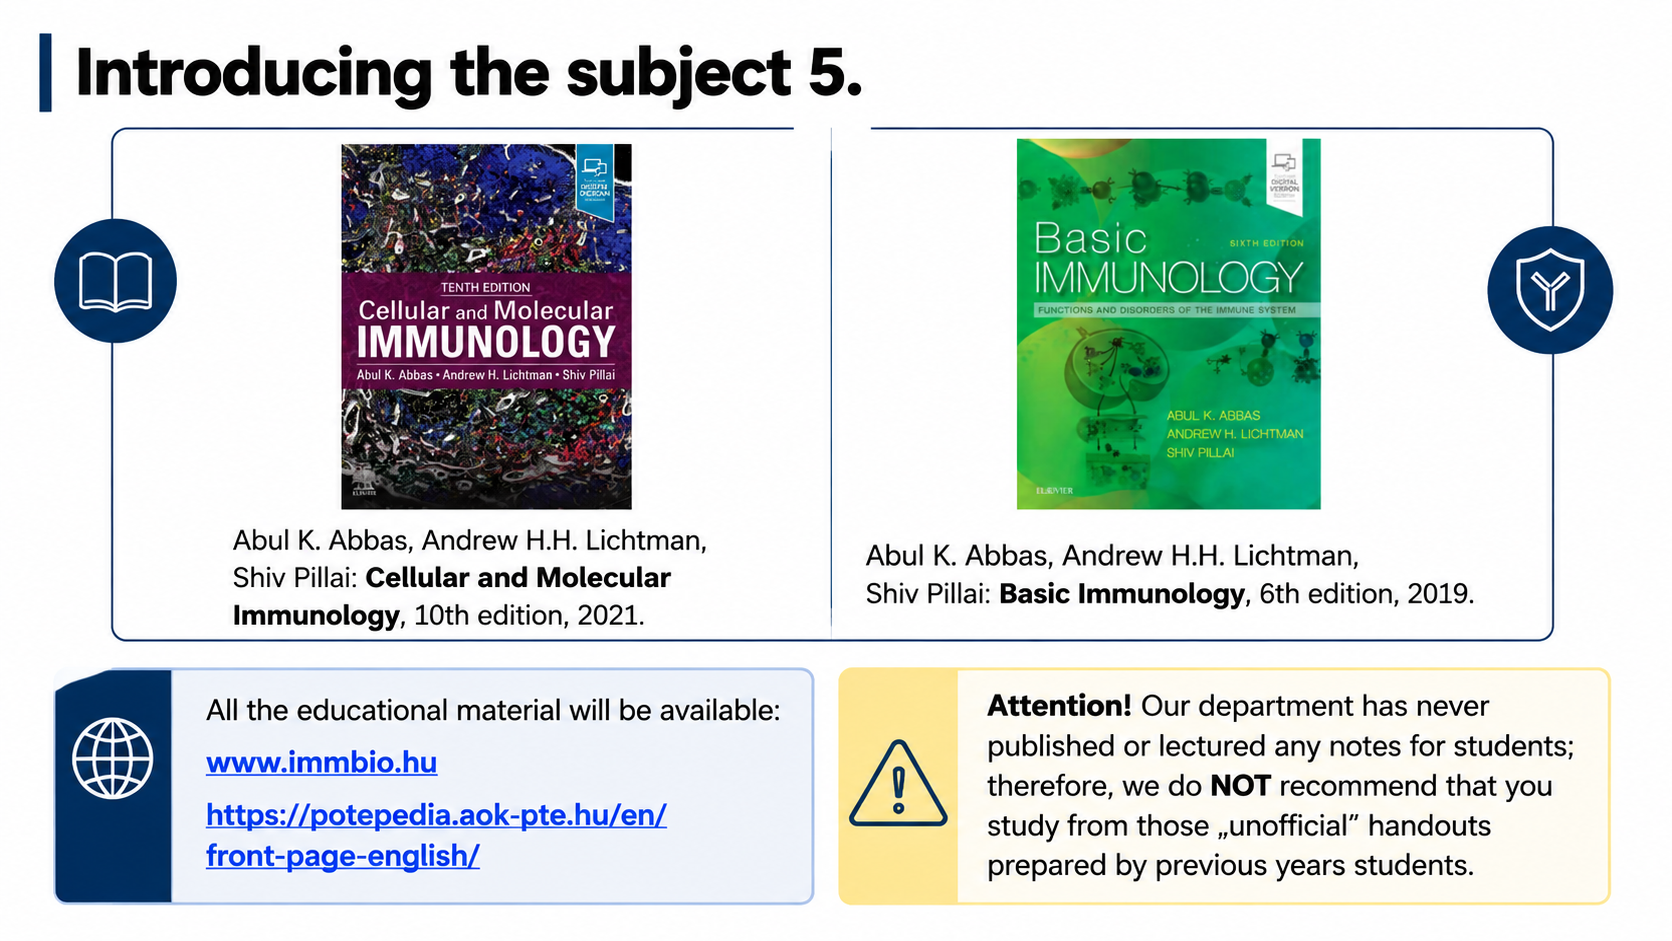
After: Redesigned slide 6 with visual textbook recommendation cards
Visual book recommendation cards with clean typography
7

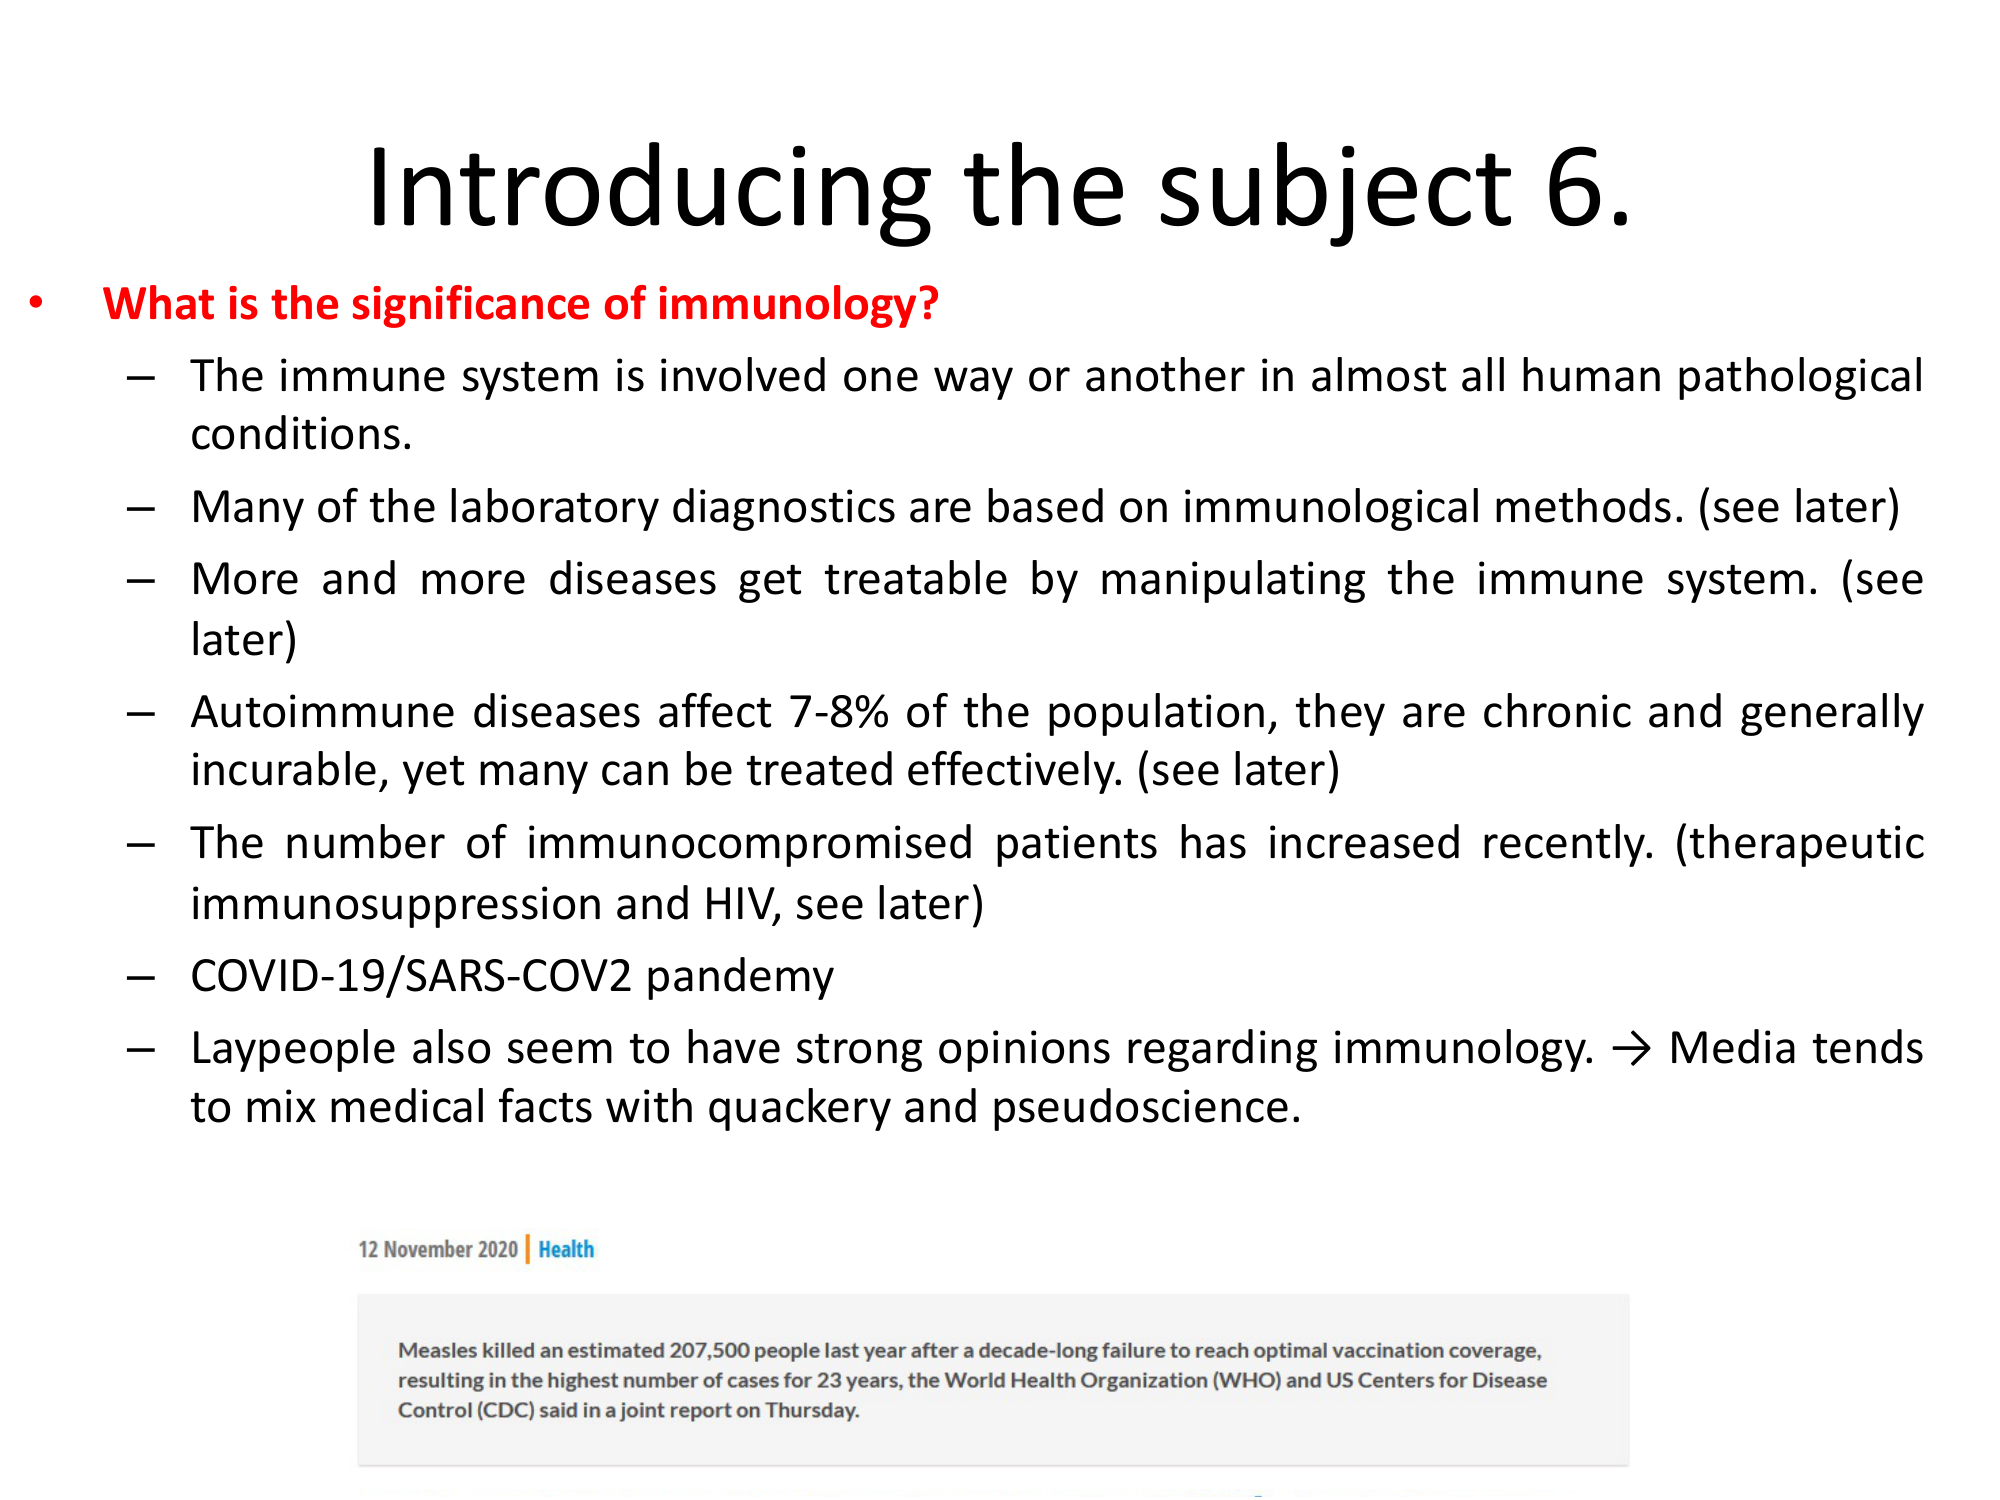
Introducing the Subject 6 — Significance of Immunology

Text about the importance of immunology in medicine. The redesign presents key points with supporting AI-generated medical icons and visual emphasis on clinical relevance.

Before
Before: Original slide 7 — text about immunology significance
Text-heavy slide on immunology significance, no visuals
After
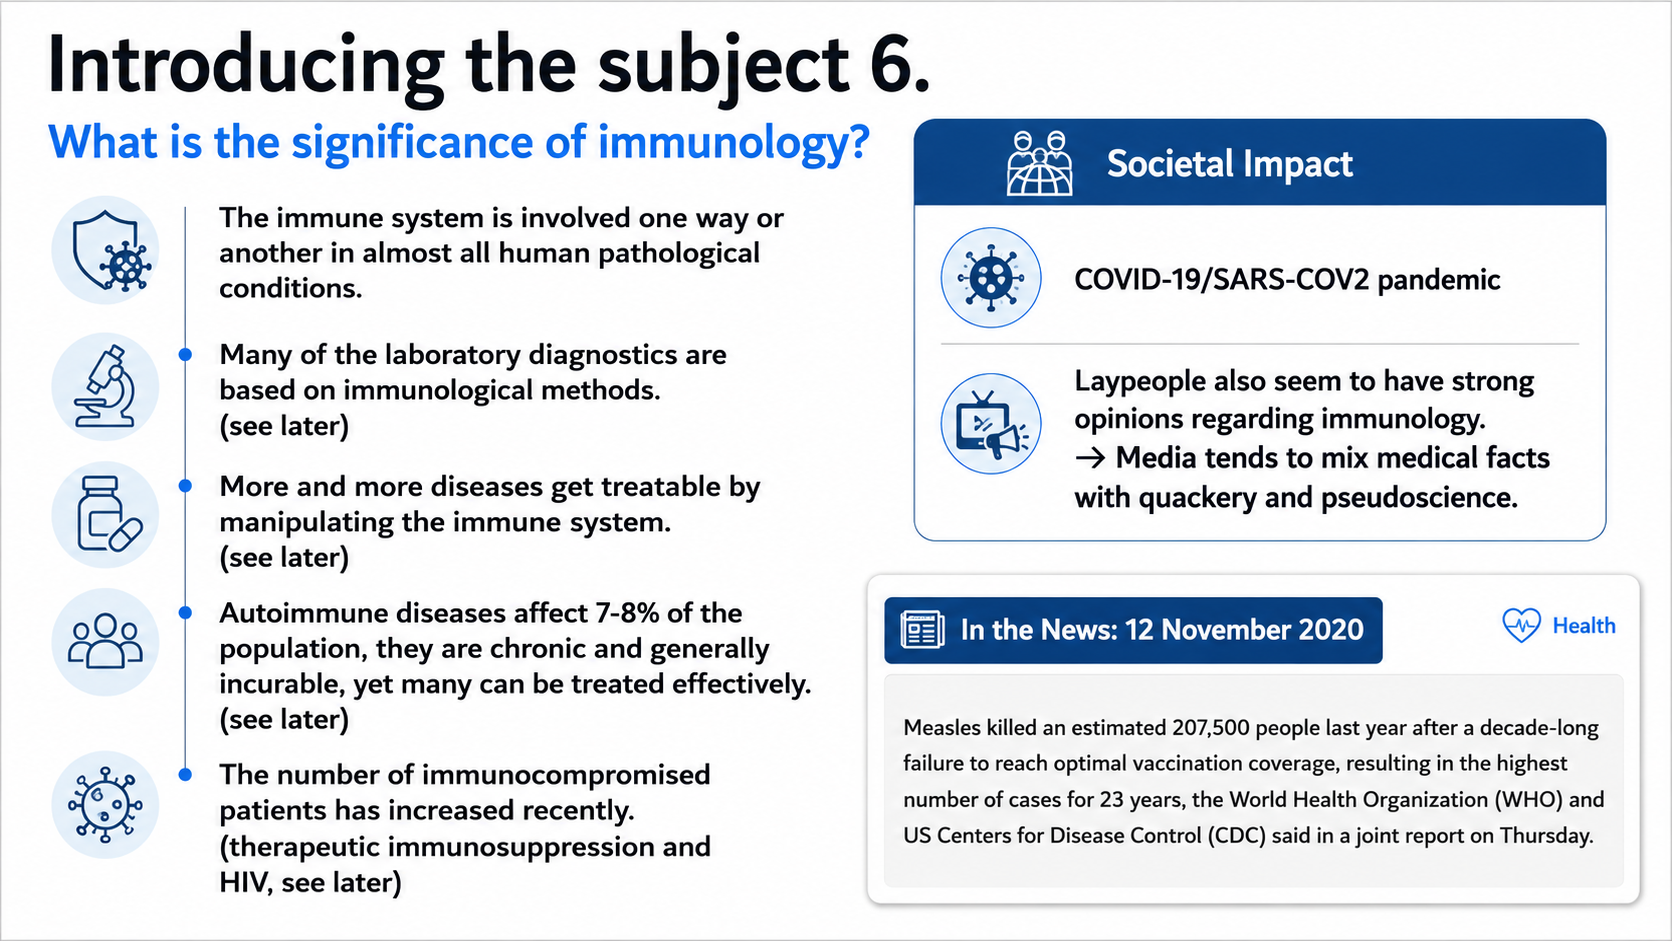
After: Redesigned slide 7 with visual emphasis on clinical relevance
Key points with AI-generated icons emphasizing clinical relevance
8

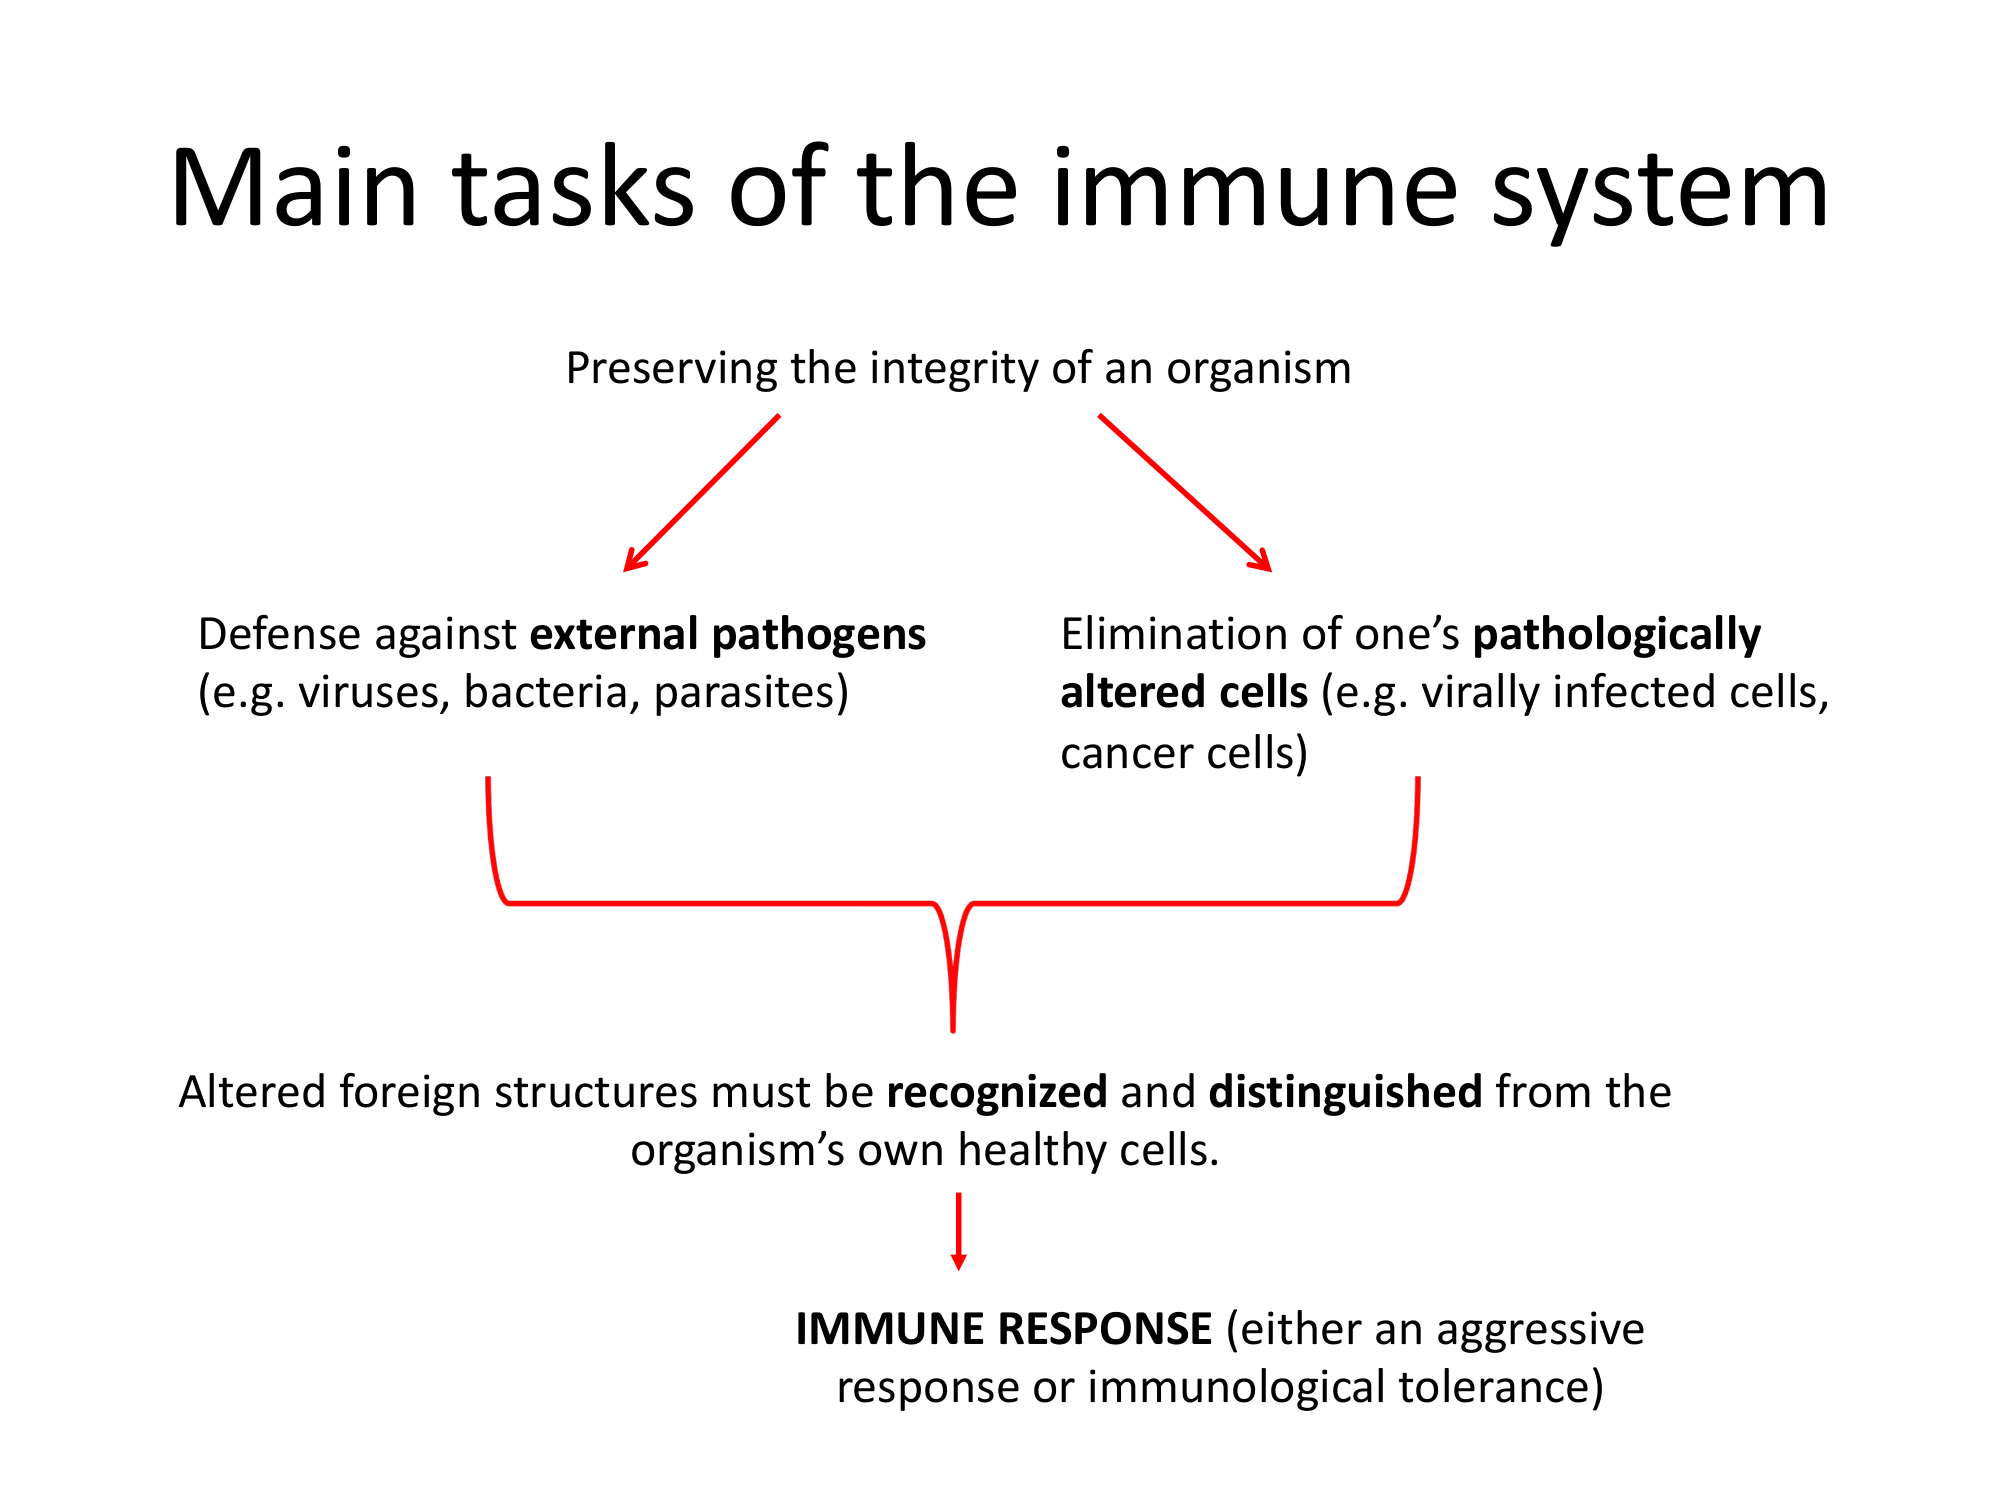
Main Tasks of the Immune System — Defense Flowchart

A basic flowchart showing immune defense vs. elimination tasks. The redesign generates a clear, color-coded process diagram with AI-illustrated immune cell icons at each step.

Before
Before: Original slide 8 — basic immune system flowchart
Basic flowchart of immune tasks, generic styling
After
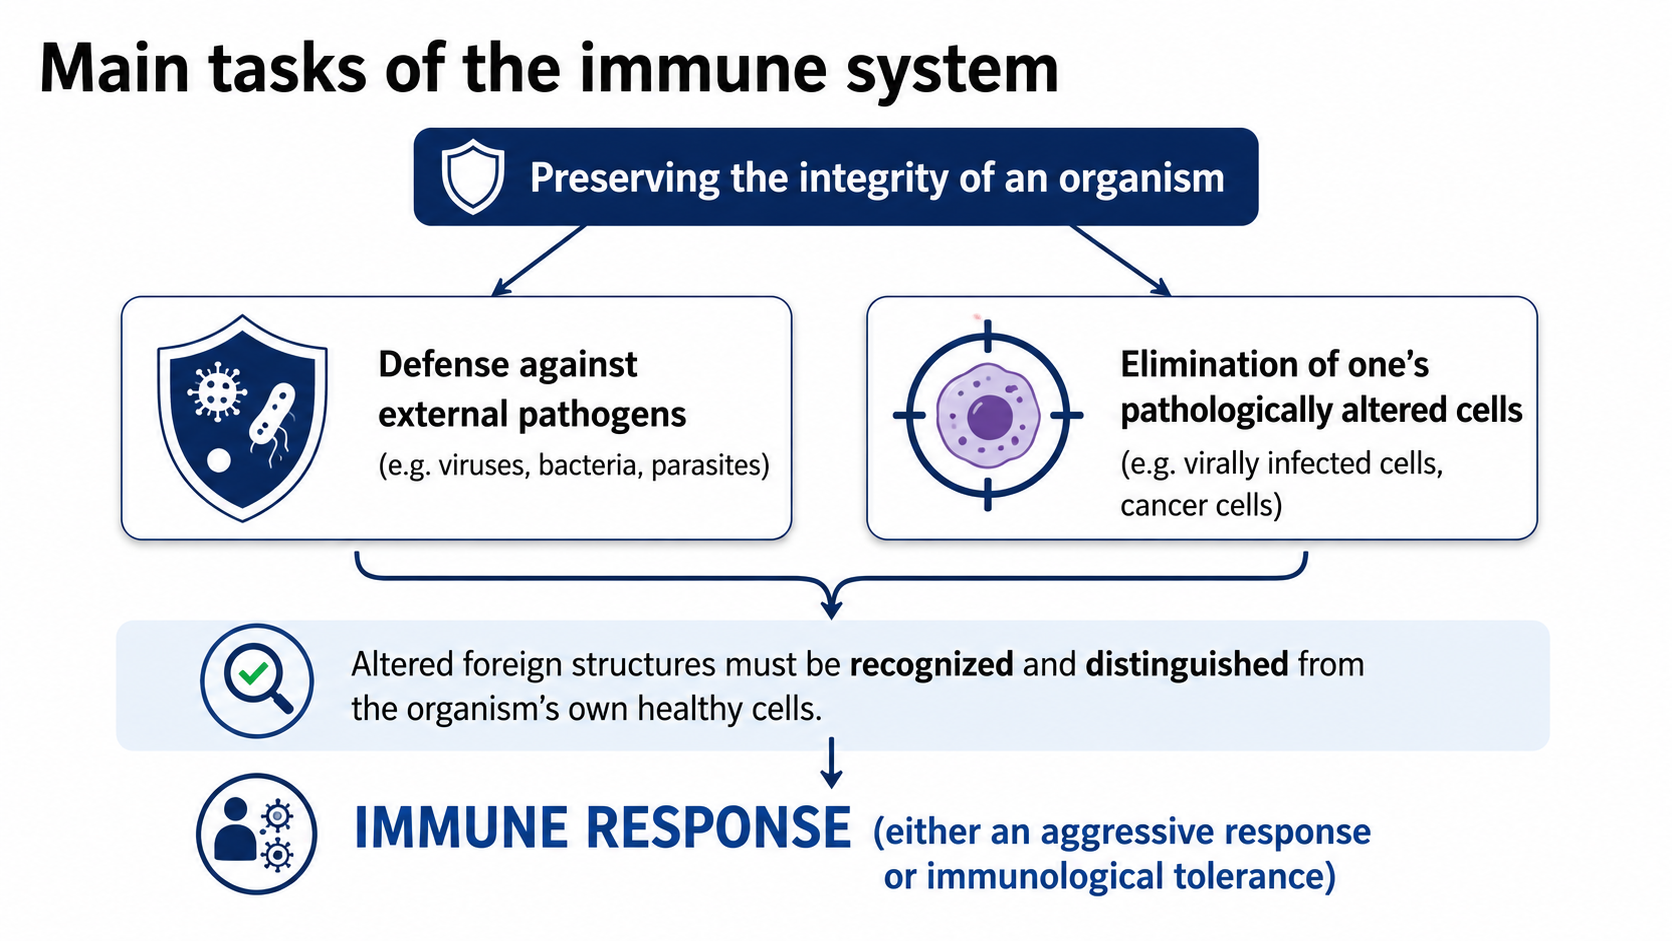
After: Redesigned slide 8 with color-coded immune process diagram
Color-coded process diagram with AI-illustrated immune cell icons
9

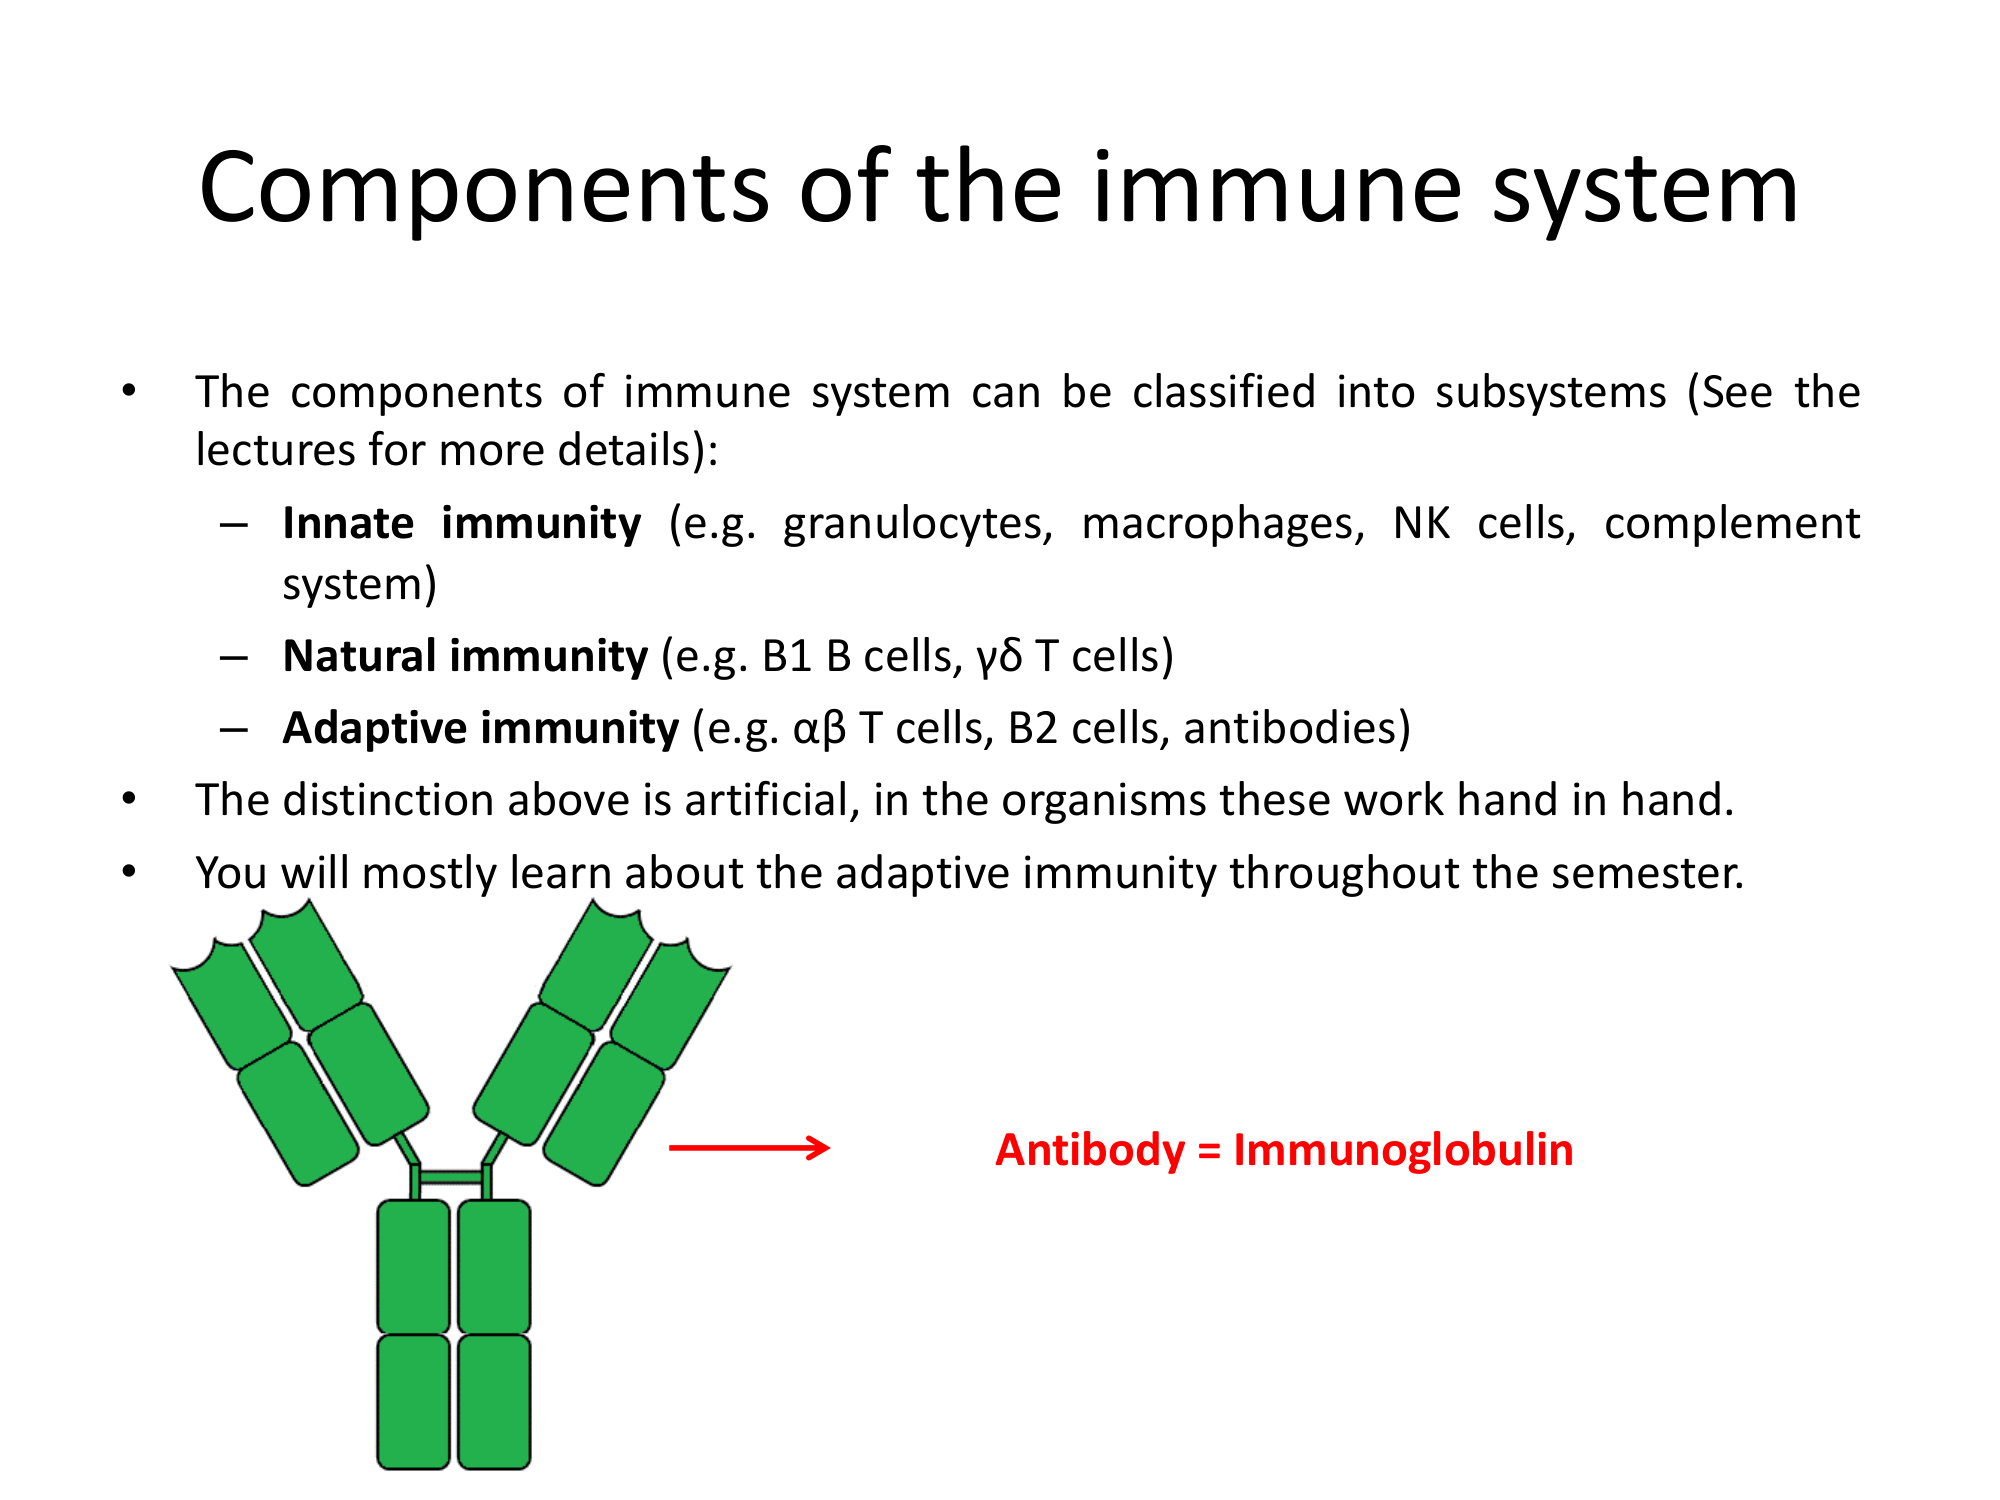
Components of the Immune System — Innate & Adaptive

Text and a generic antibody diagram showing innate vs. adaptive immunity. The redesign creates a precise AI-generated illustration showing both arms of the immune system with labeled cell types and antibody structures.

Before
Before: Original slide 9 — text with generic antibody diagram
Generic antibody diagram with dense text, inconsistent style
After
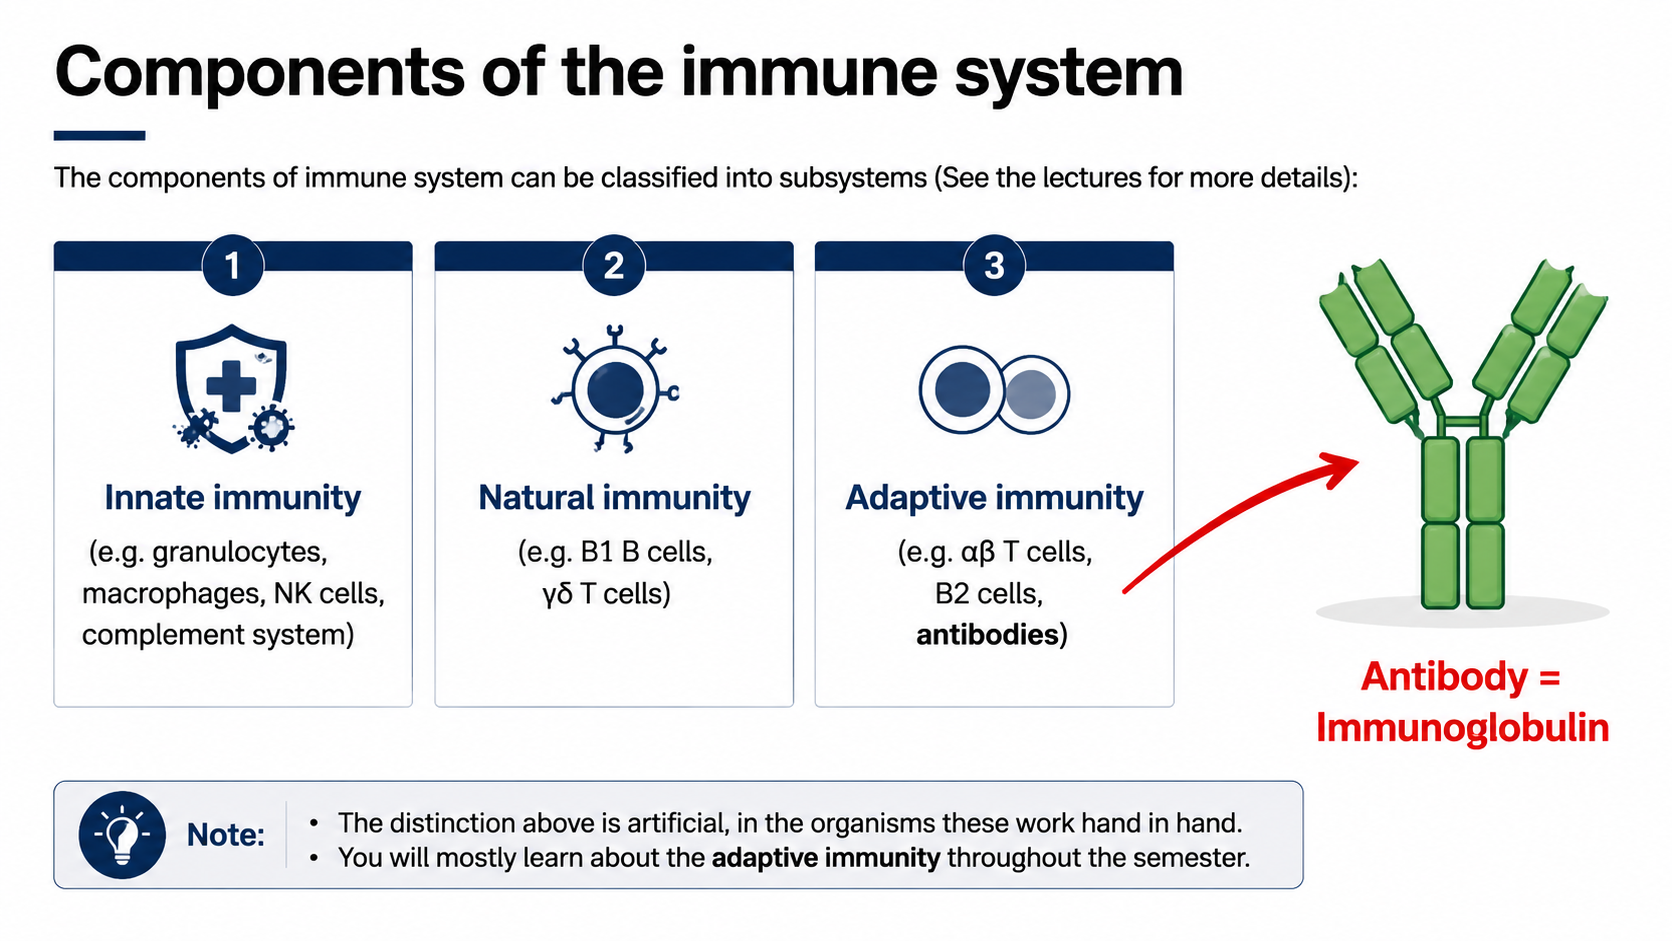
After: Redesigned slide 9 with AI-generated immune system illustration
AI-generated illustration of innate and adaptive immunity with labeled cell types
10

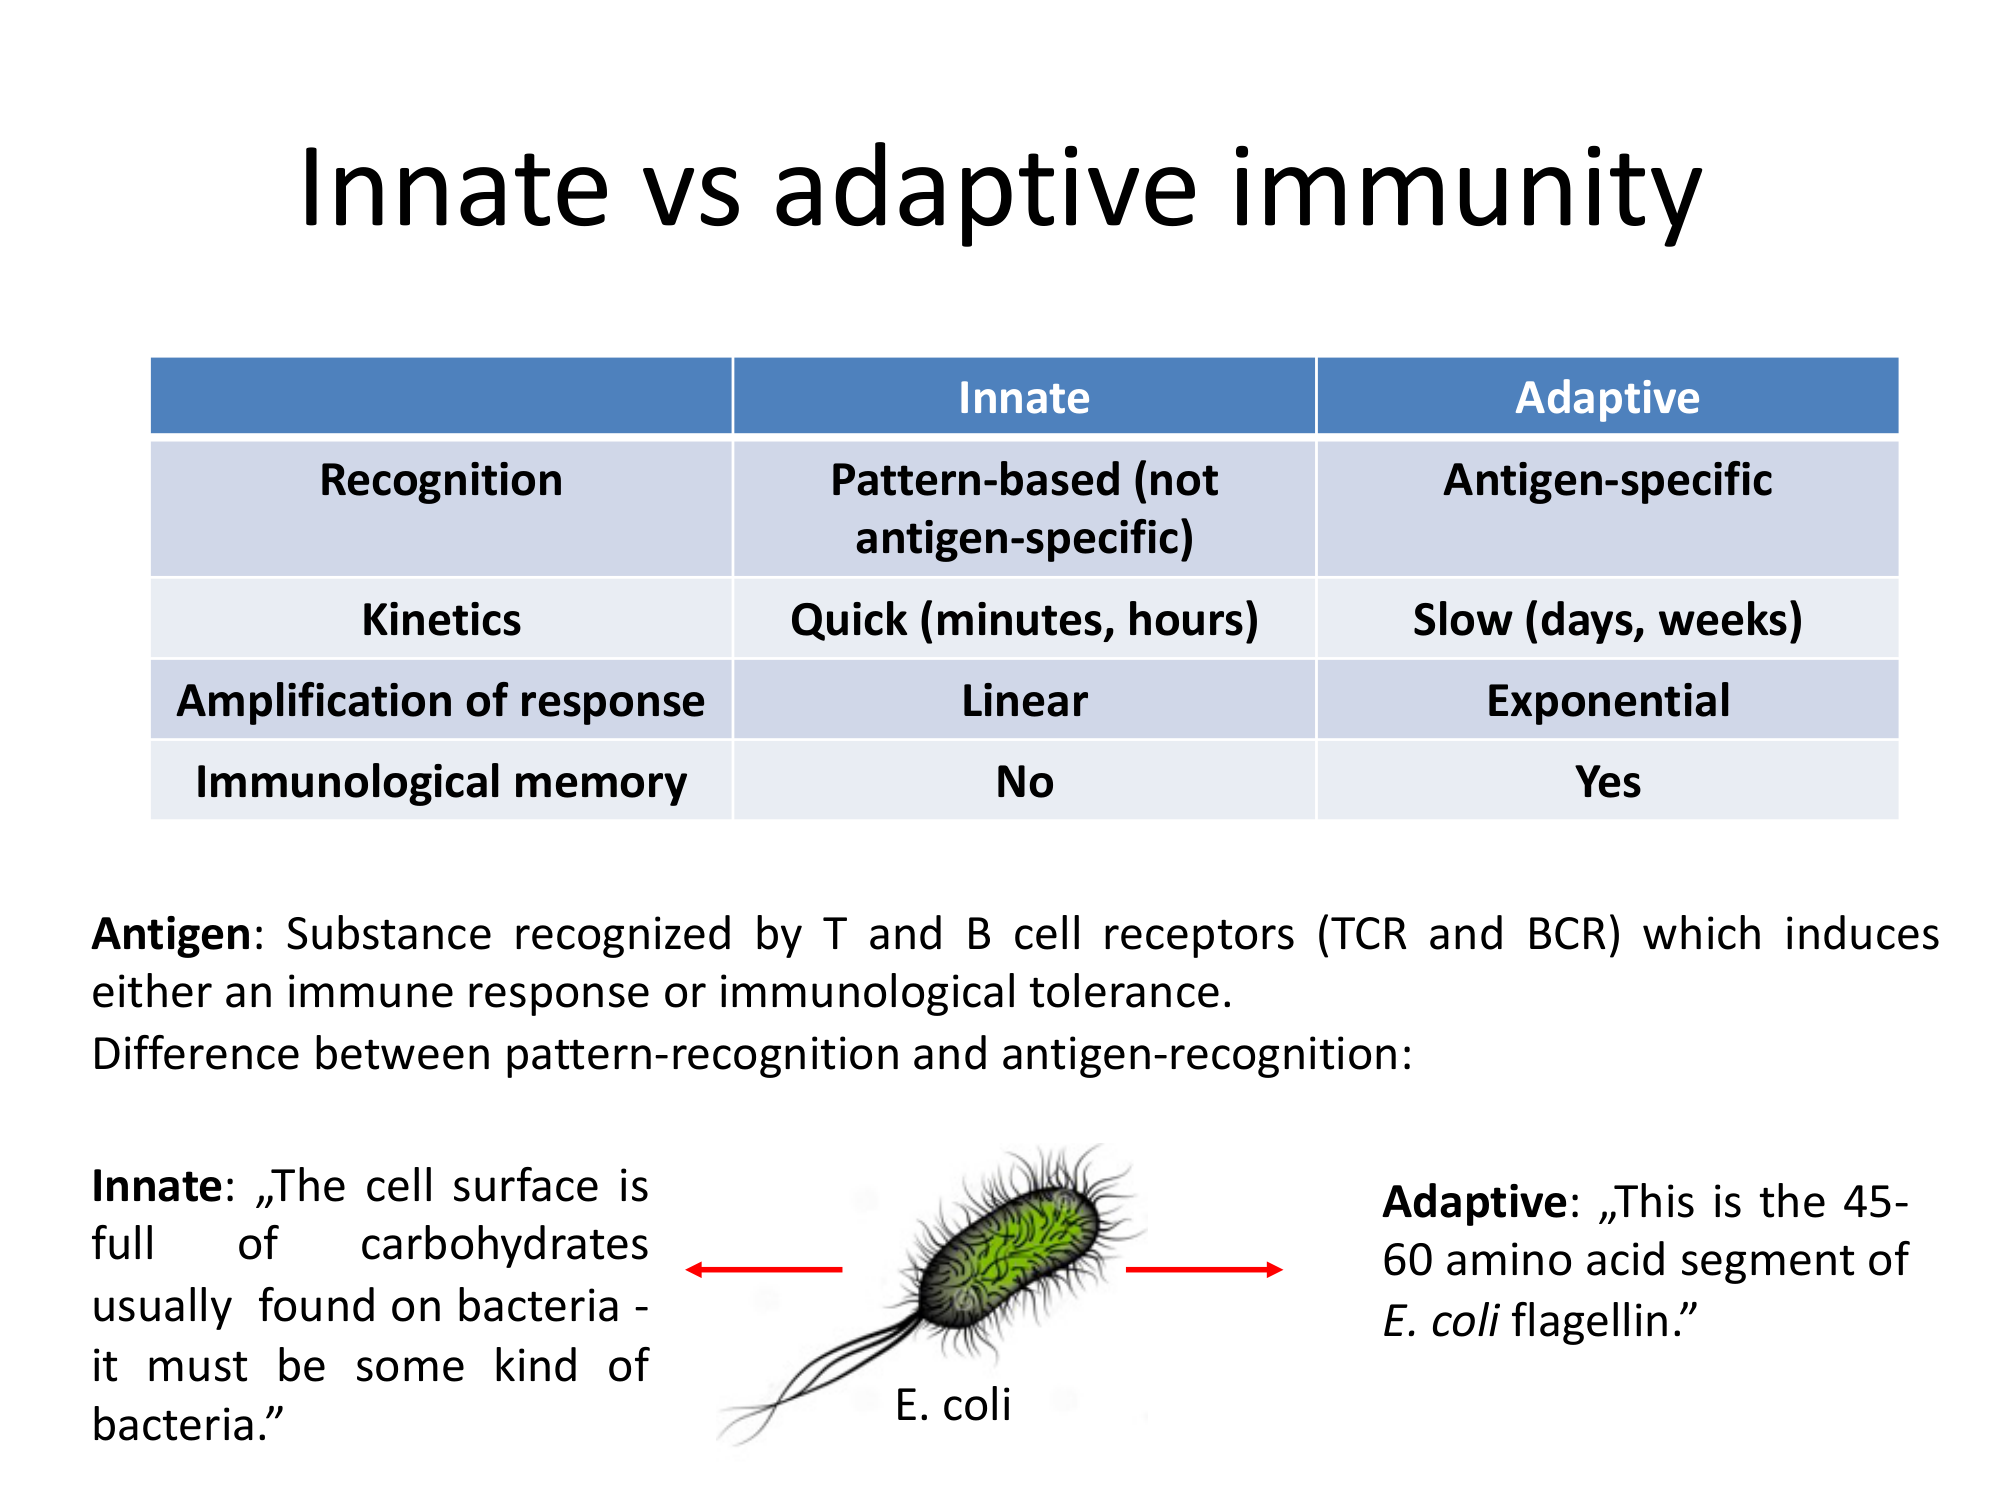
Innate vs. Adaptive Immunity — Comparison Table

A comparison table with an E. coli illustration showing differences between innate and adaptive immunity. The redesign produces a clean visual comparison with AI-generated pathogen and cell illustrations.

Before
Before: Original slide 10 — comparison table with E. coli
Basic comparison table, generic E. coli illustration
After
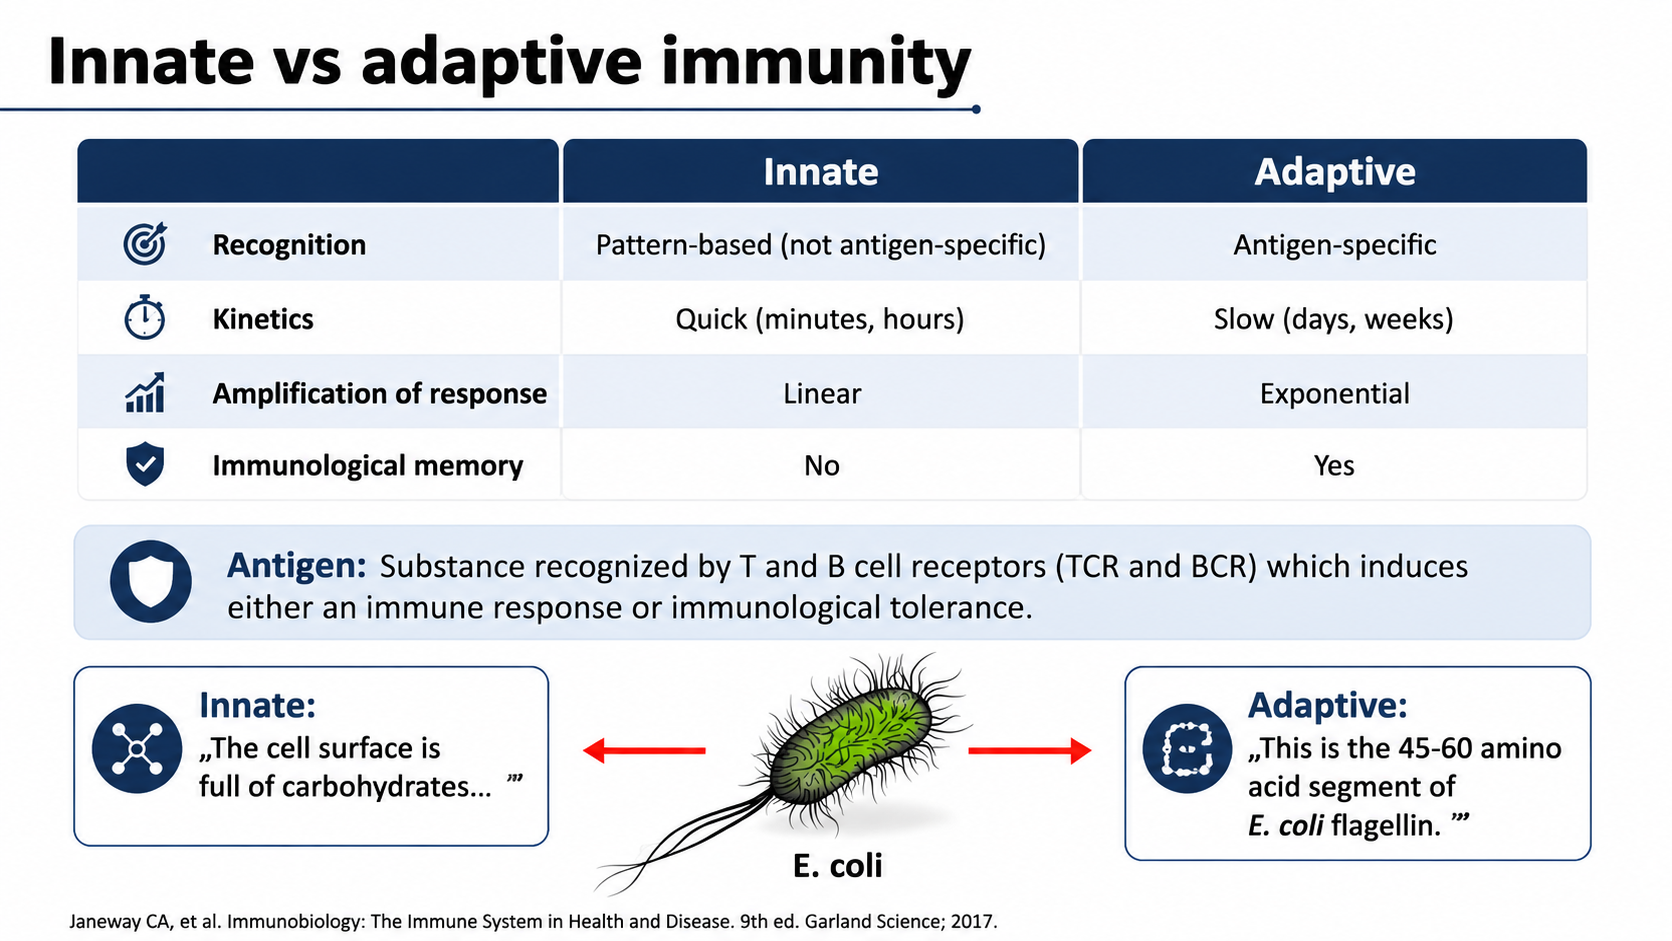
After: Redesigned slide 10 with visual immunity comparison and AI-generated cells
Visual comparison with AI-generated pathogen and immune cell illustrations
11

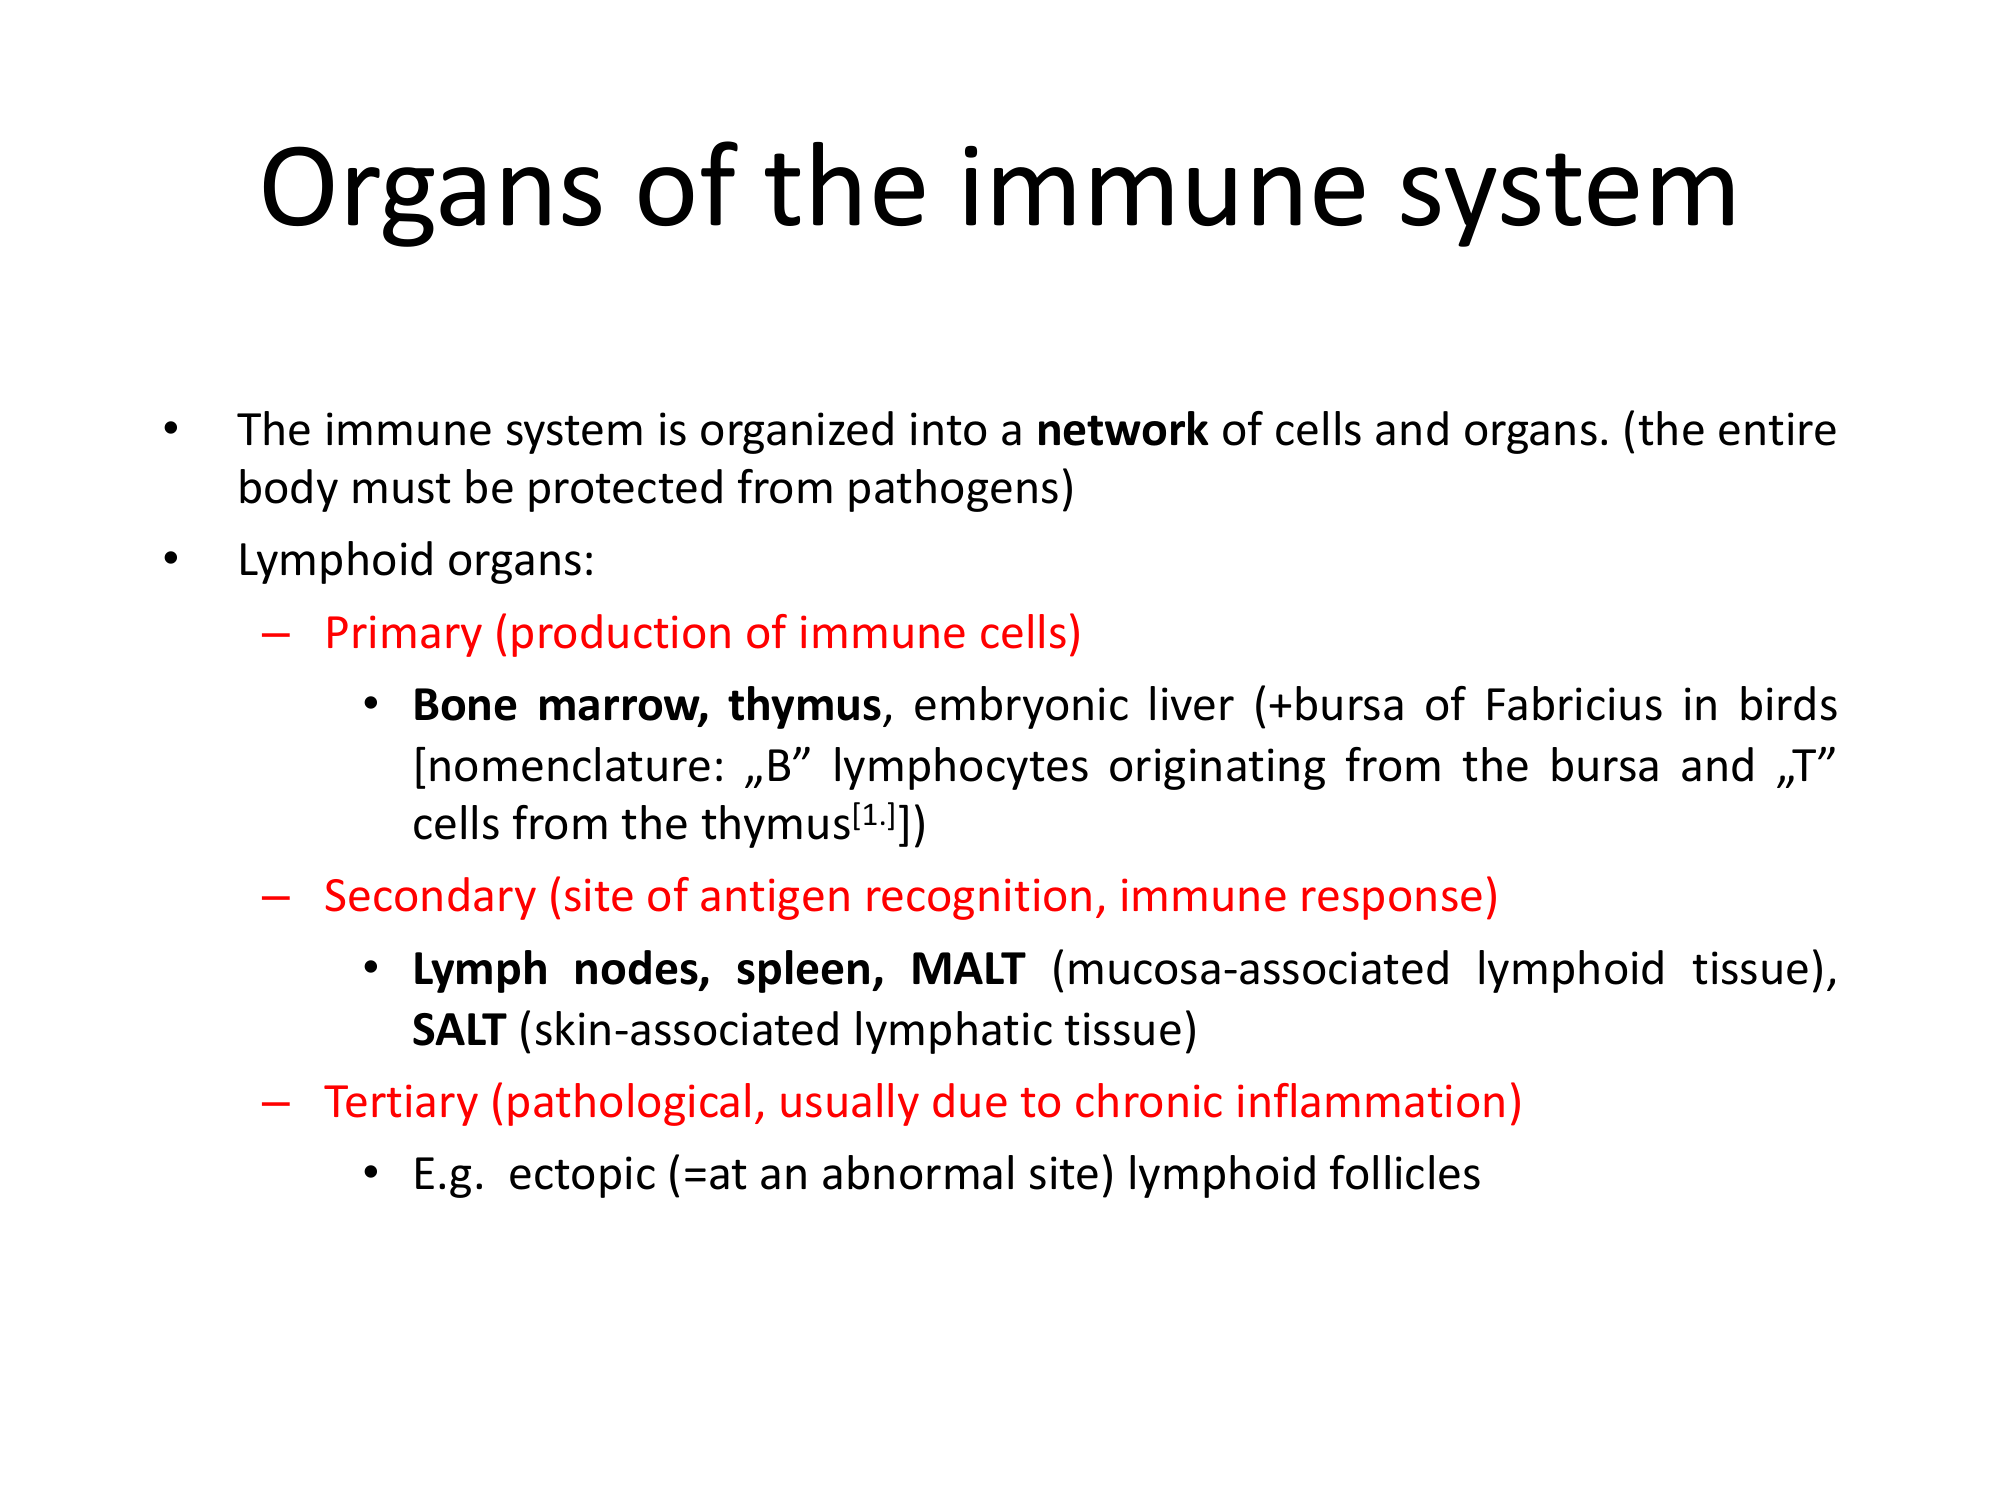
Organs of the Immune System — Classification

Text listing primary, secondary, and tertiary lymphoid organs. The redesign transforms the classification into a visual hierarchy diagram with AI-generated organ thumbnails.

Before
Before: Original slide 11 — text list of lymphoid organs
Text-only classification of lymphoid organs, no visuals
After
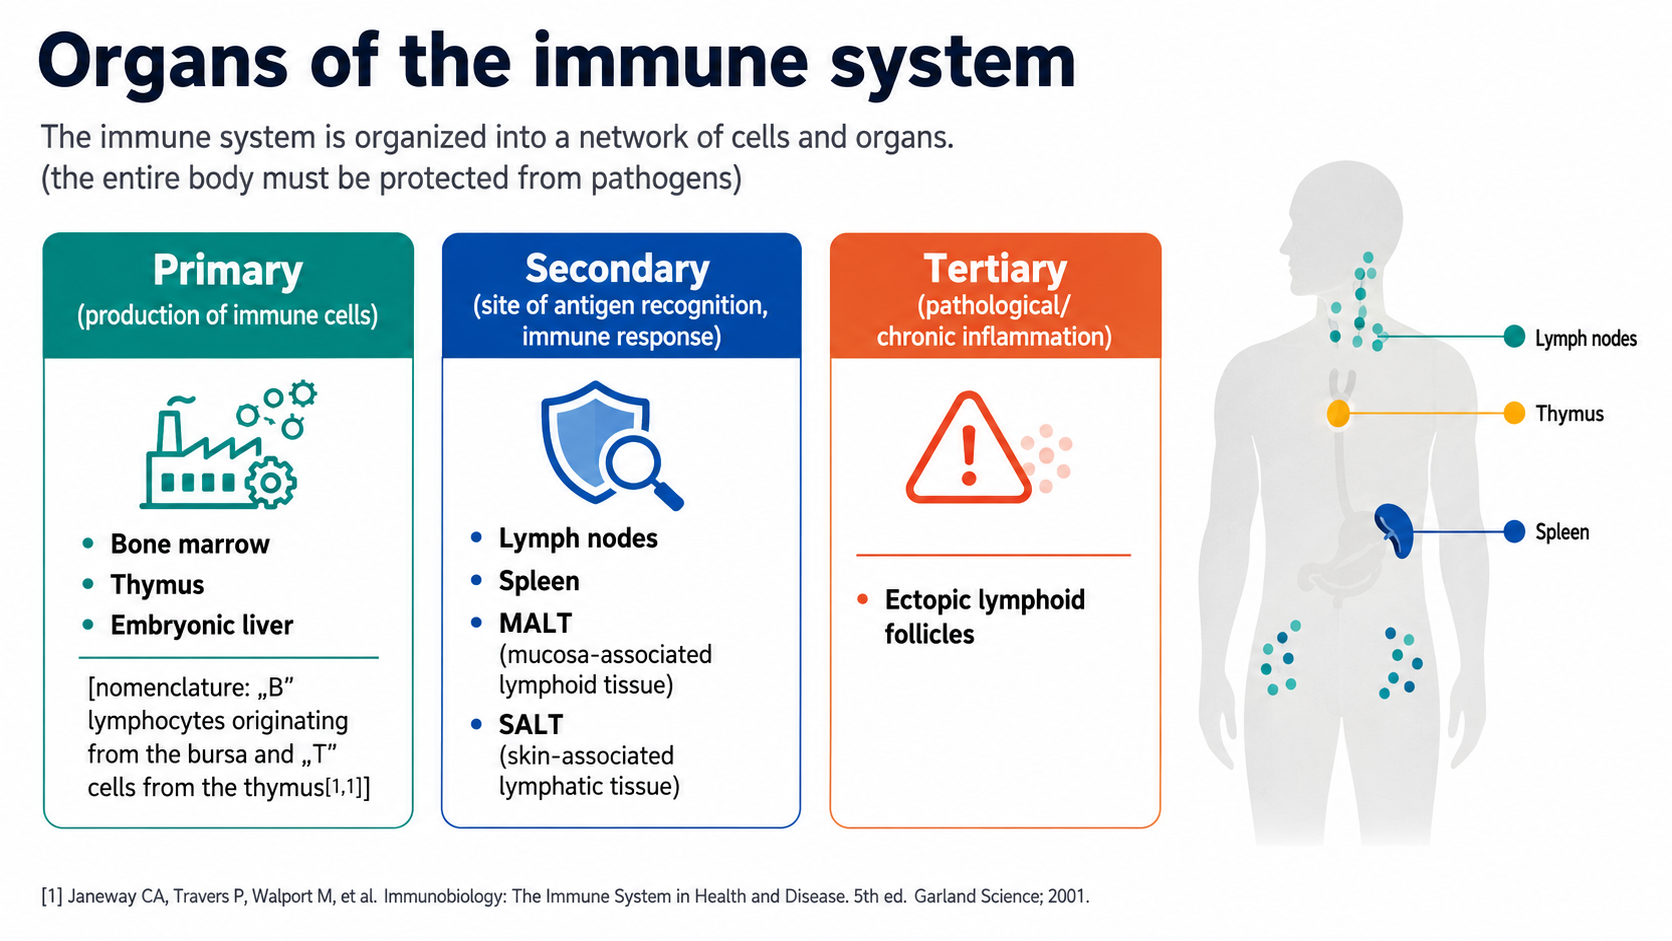
After: Redesigned slide 11 with visual organ classification hierarchy
Visual hierarchy diagram with AI-generated organ thumbnails for each category
12

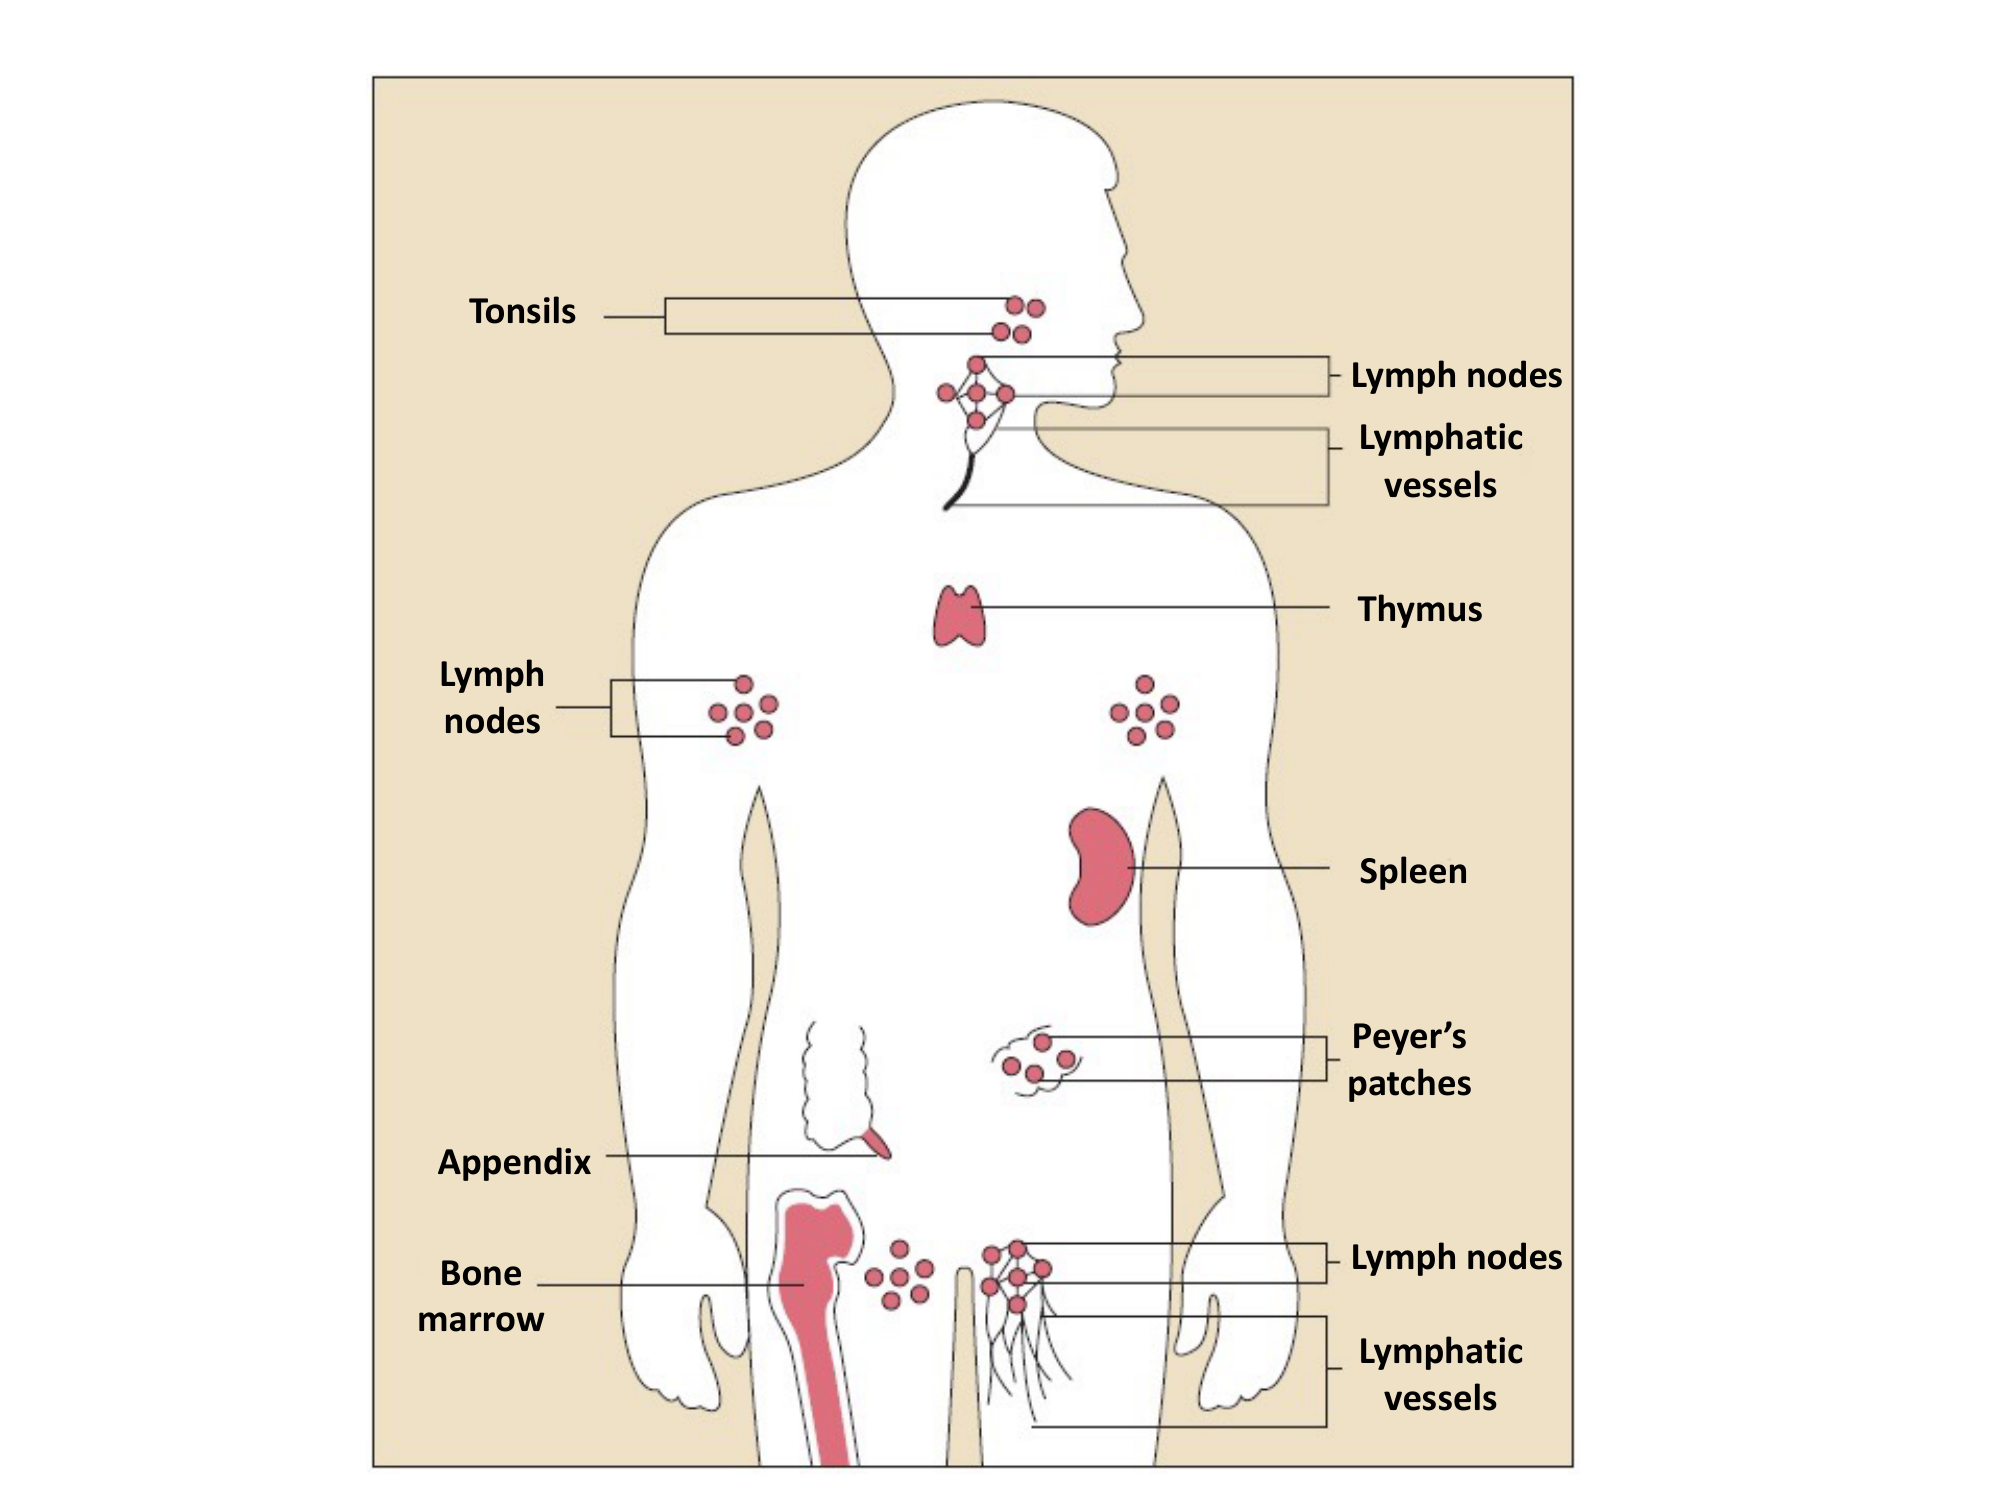
Anatomical Distribution — Body Silhouette Diagram

A body silhouette with labeled lymphoid organ locations (tonsils, thymus, spleen, Peyer's patches, bone marrow, lymph nodes). The redesign generates a precise AI anatomical illustration with clear organ placement and color-coded labels.

Before
Before: Original slide 12 — basic body silhouette with organ labels
Basic body silhouette, generic labels, low-resolution diagram
After
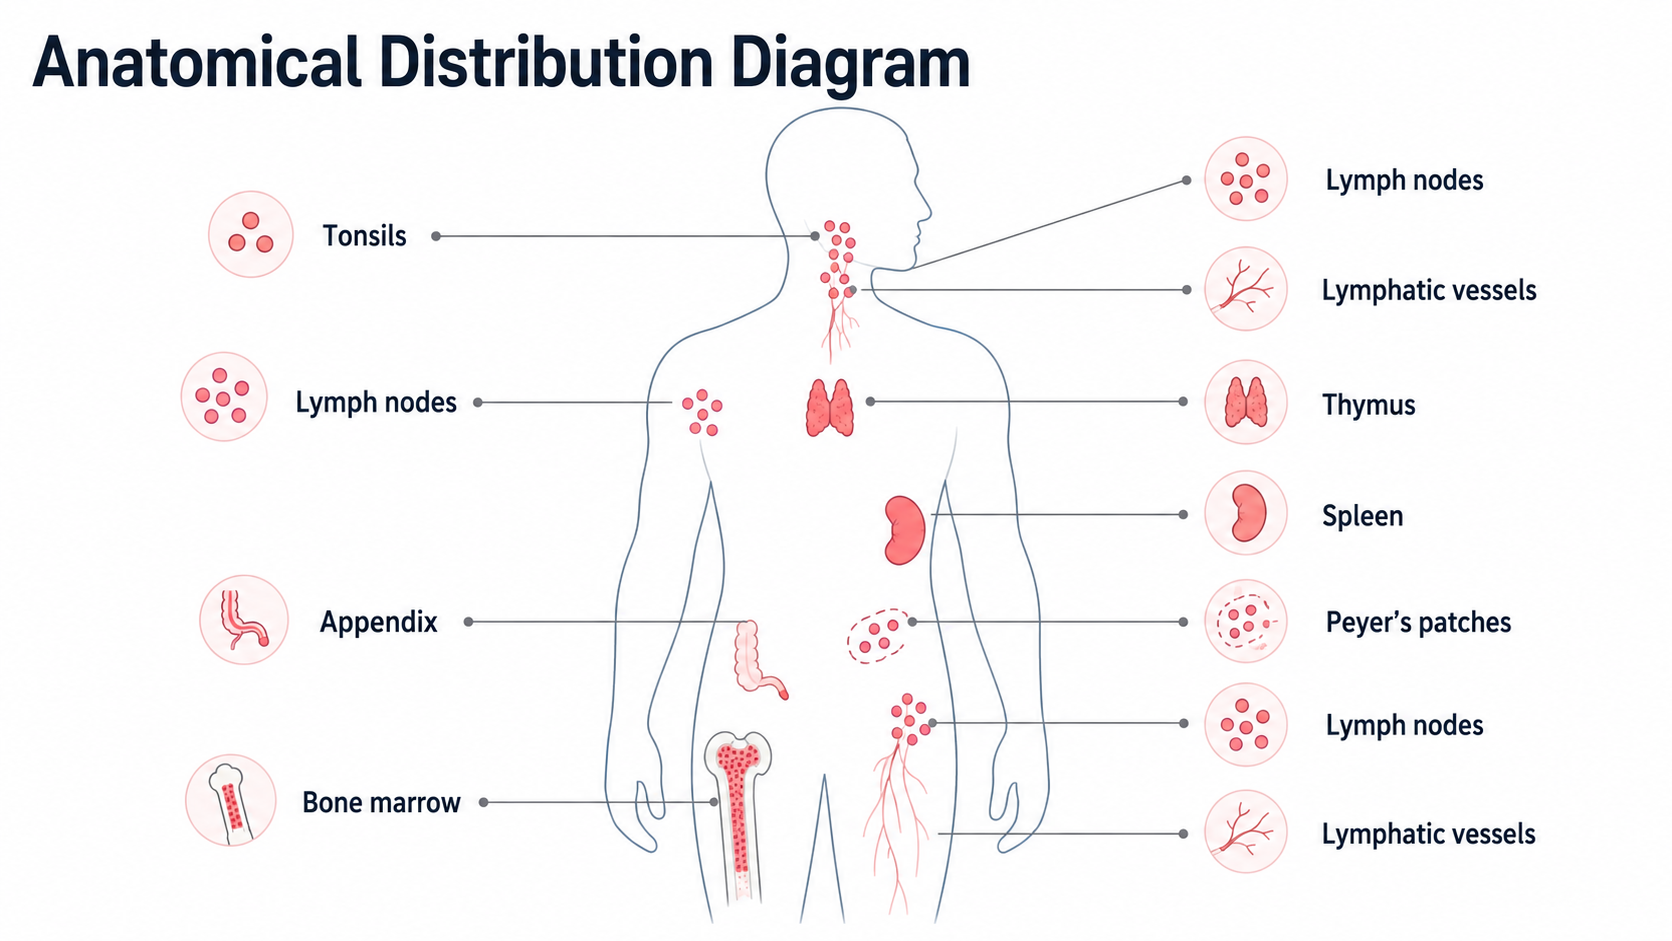
After: Redesigned slide 12 with AI-generated anatomical illustration
AI-generated anatomical illustration with precise organ placement and color-coded labels
13

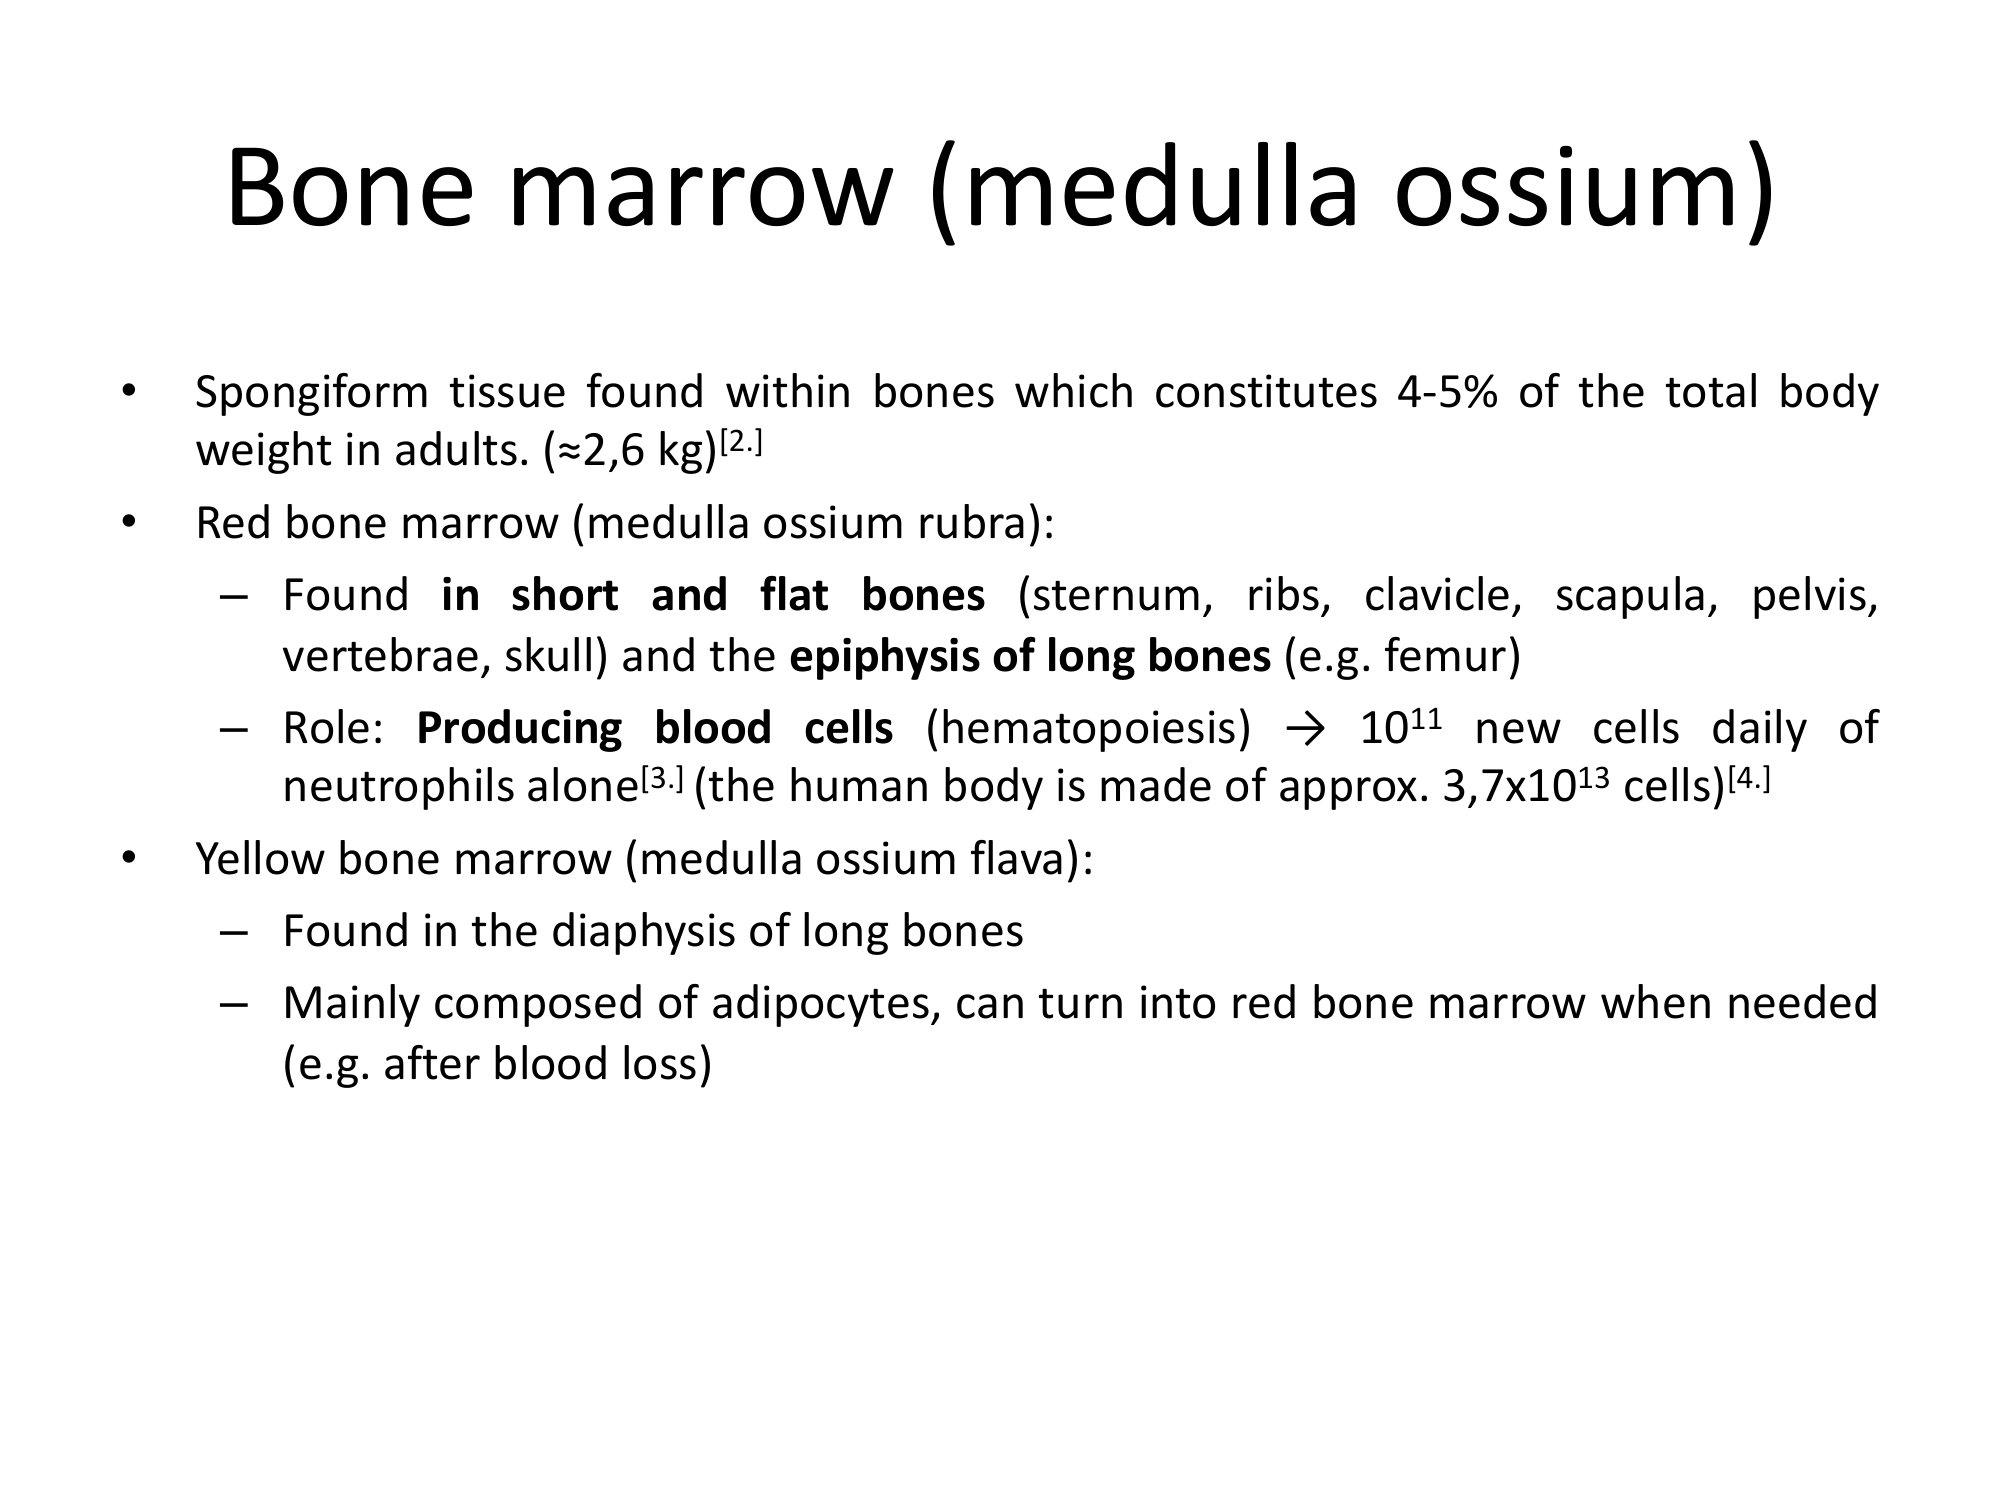
Bone Marrow (Medulla Ossium) — Overview

Text about red vs. yellow bone marrow with minimal visuals. The redesign creates an AI-generated cross-section illustration of bone marrow showing the transition from red to yellow marrow.

Before
Before: Original slide 13 — text about bone marrow types
Text description of red vs. yellow bone marrow, minimal illustration
After
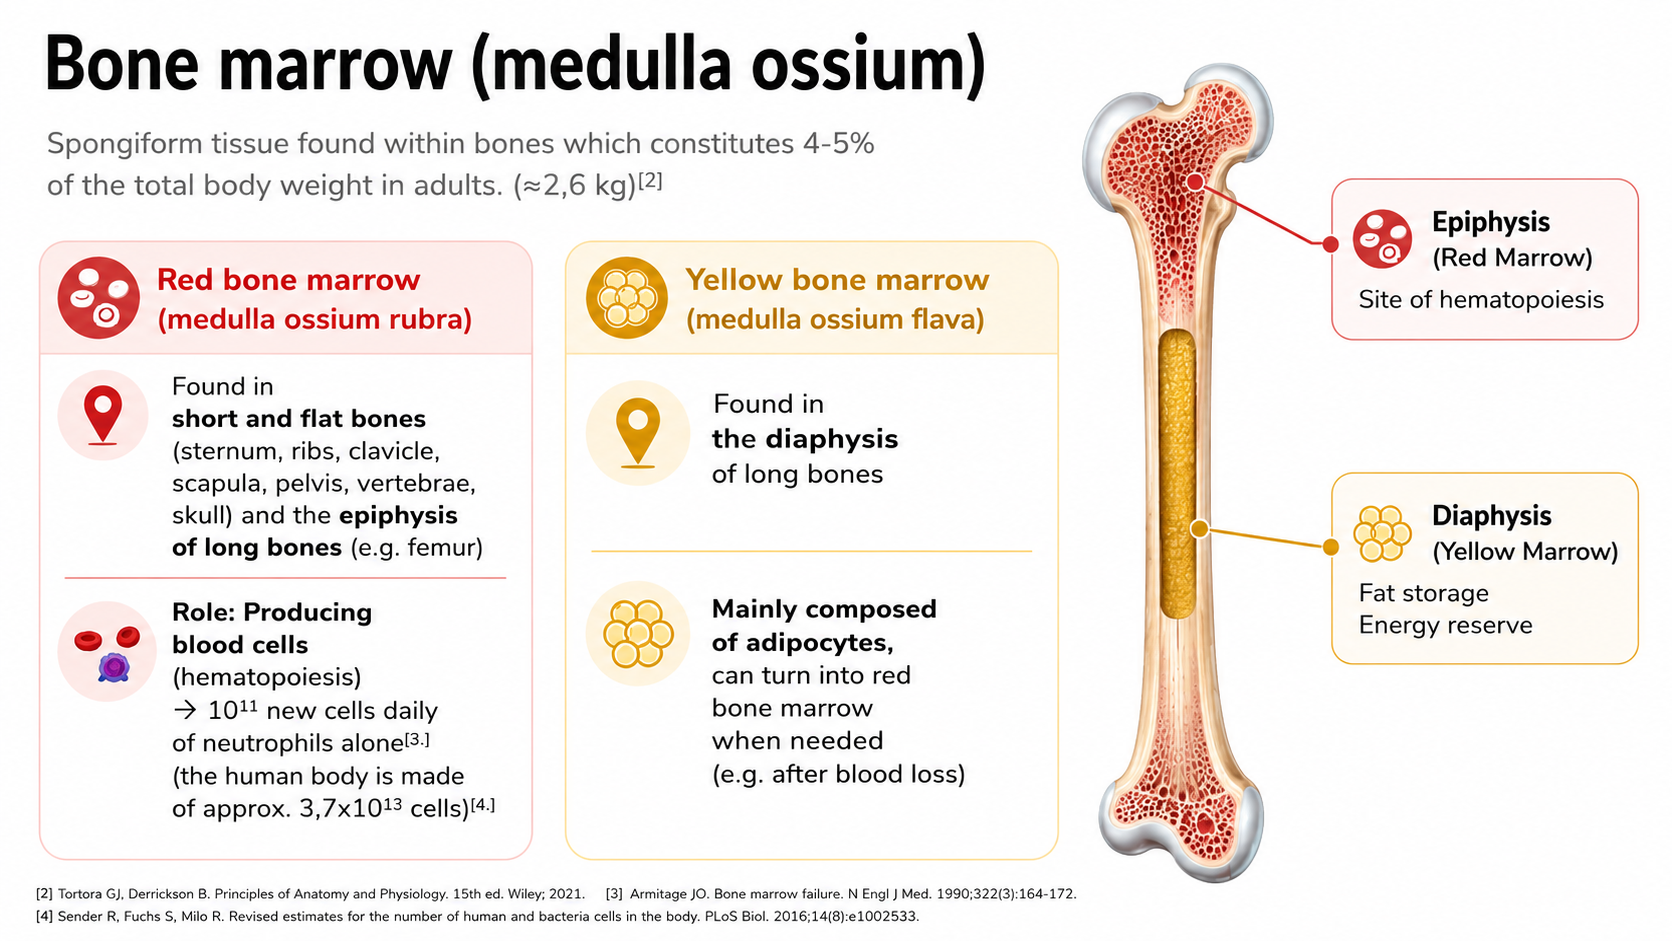
After: Redesigned slide 13 with AI-generated bone marrow cross-section
AI-generated bone marrow cross-section showing red and yellow marrow transition
14

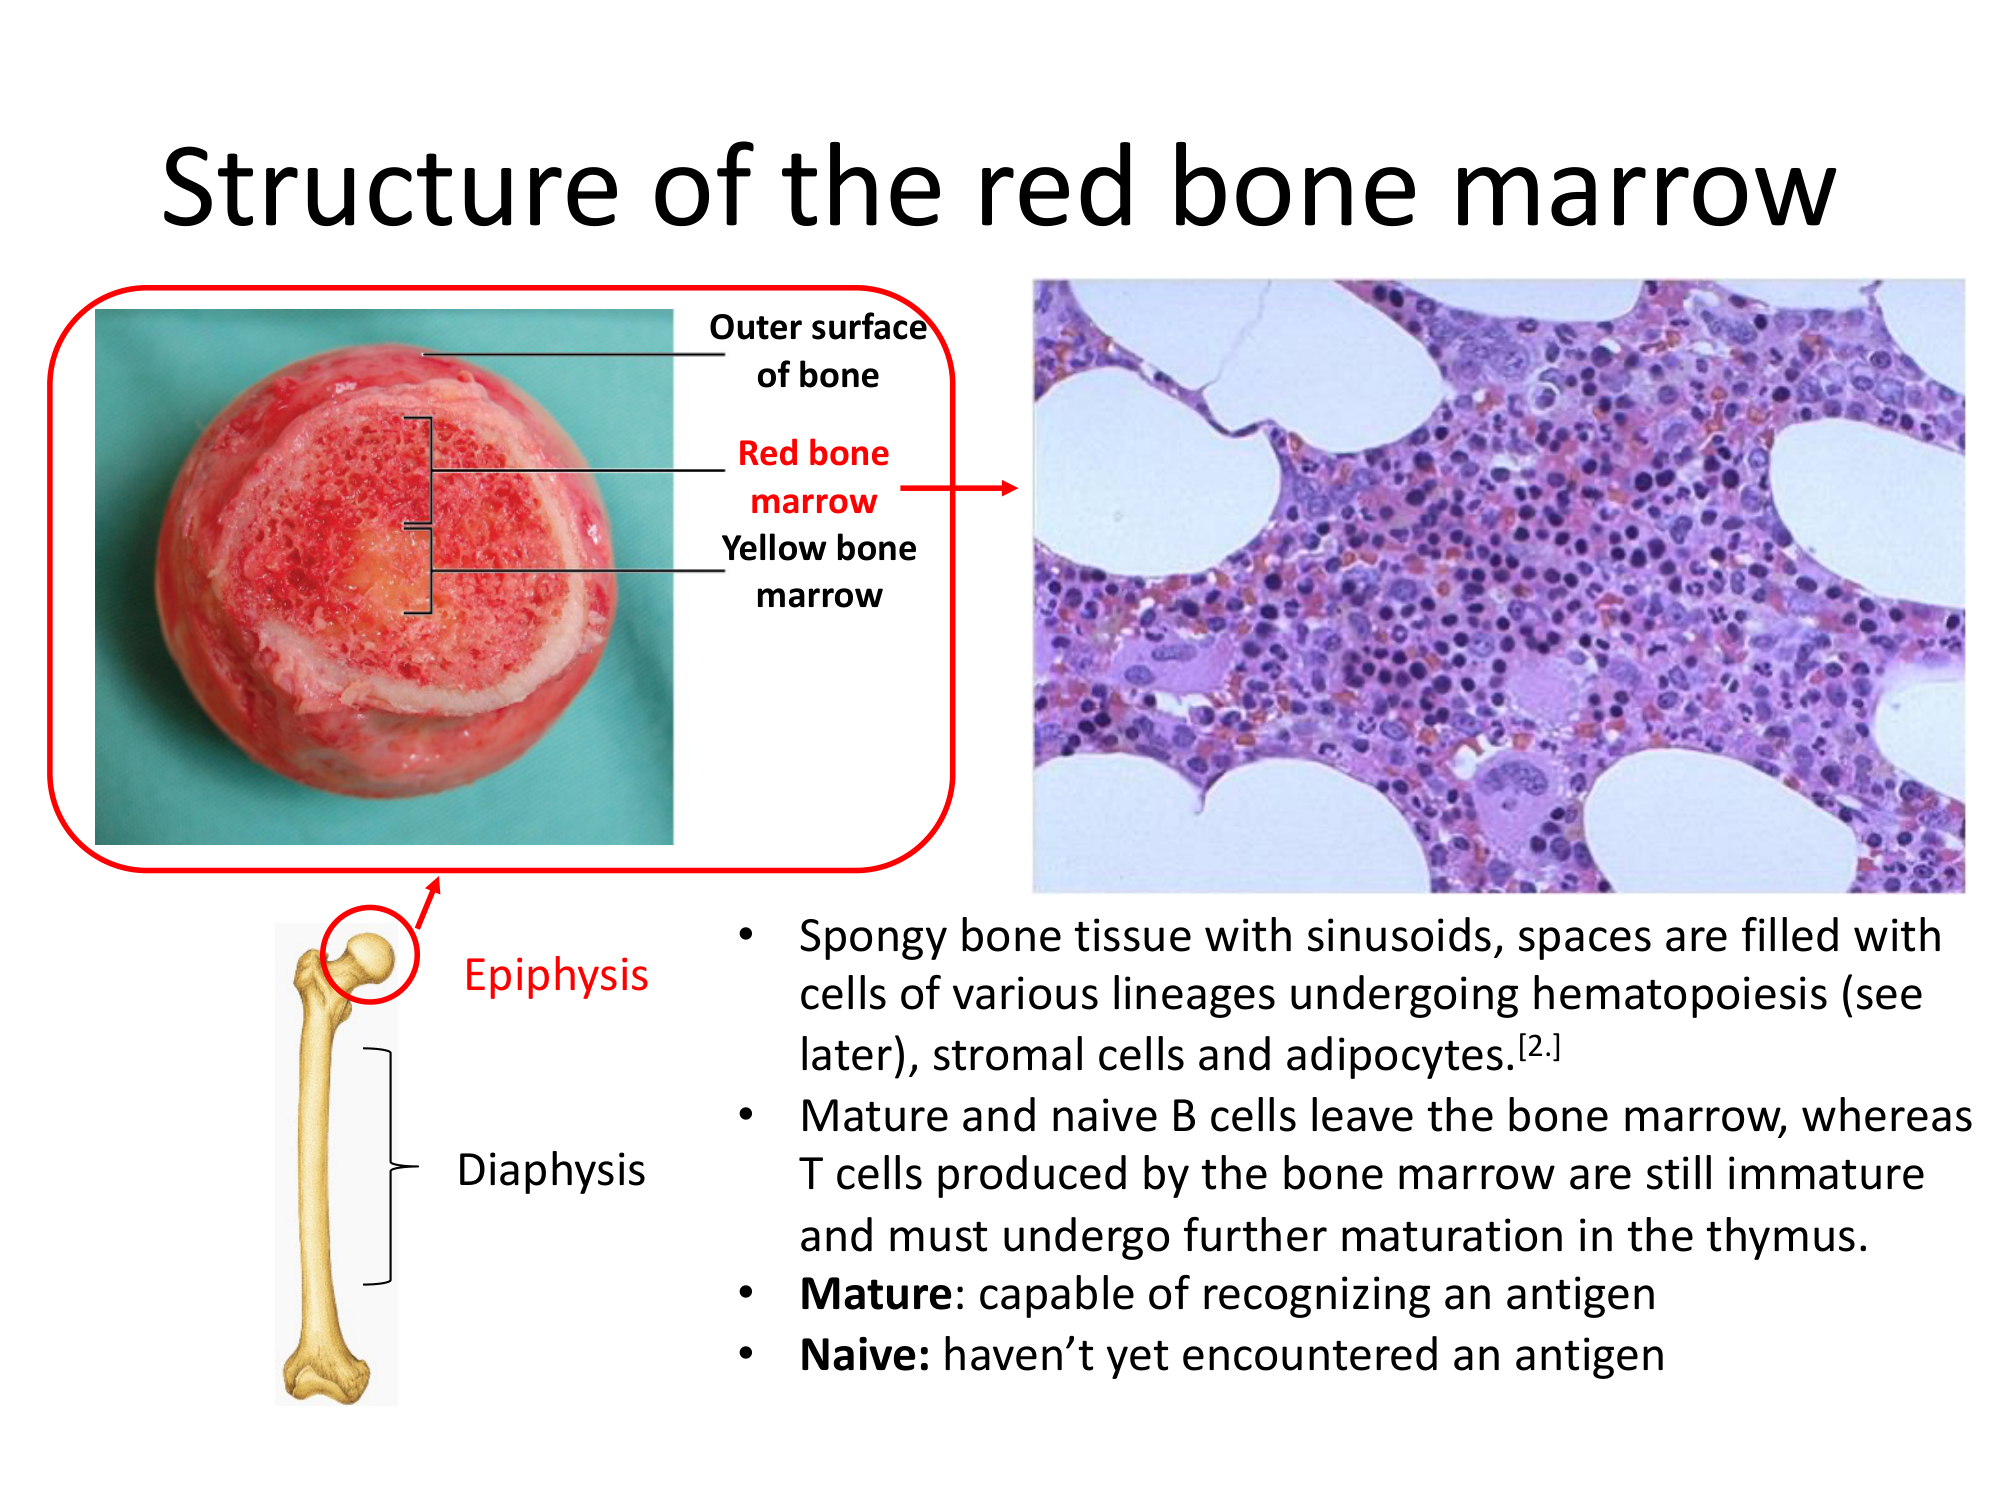
Structure of the Red Bone Marrow — Cross-Section

Microscopy image and a bone diagram showing red bone marrow structure. The redesign integrates the microscopy with a clean AI-generated anatomical cross-section and labeled structural elements.

Before
Before: Original slide 14 — microscopy and bone diagram of red marrow
Microscopy photo and bone diagram, cluttered layout, overlapping labels
After
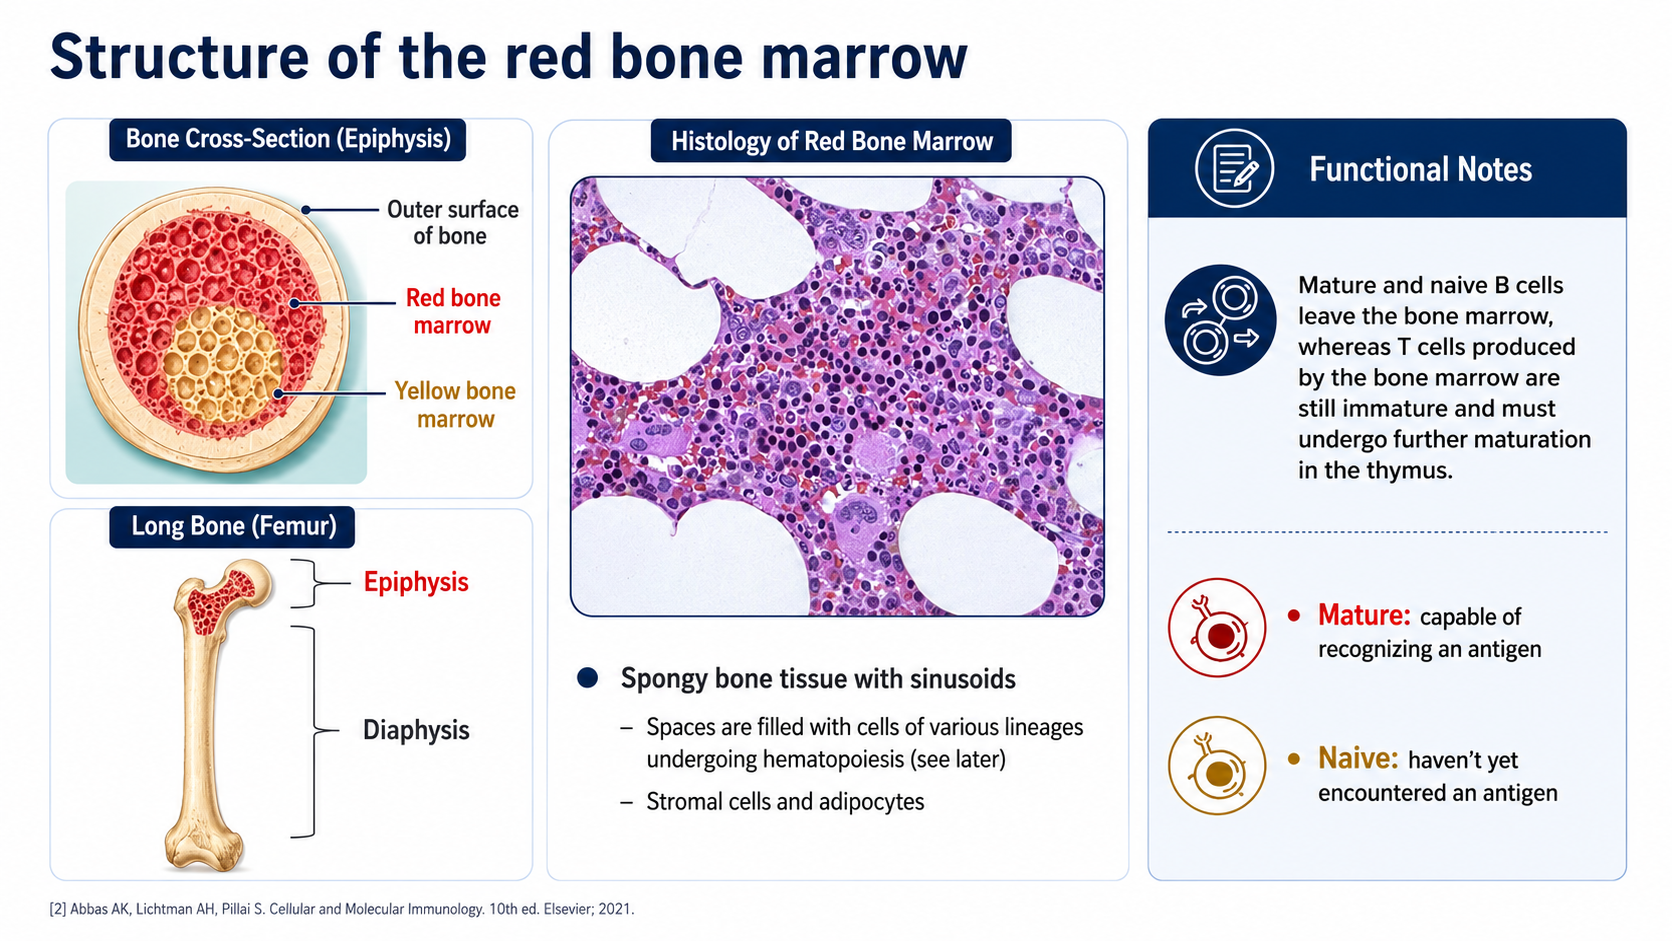
After: Redesigned slide 14 with integrated AI anatomical cross-section
AI-generated anatomical cross-section with integrated microscopy and clear labels
15

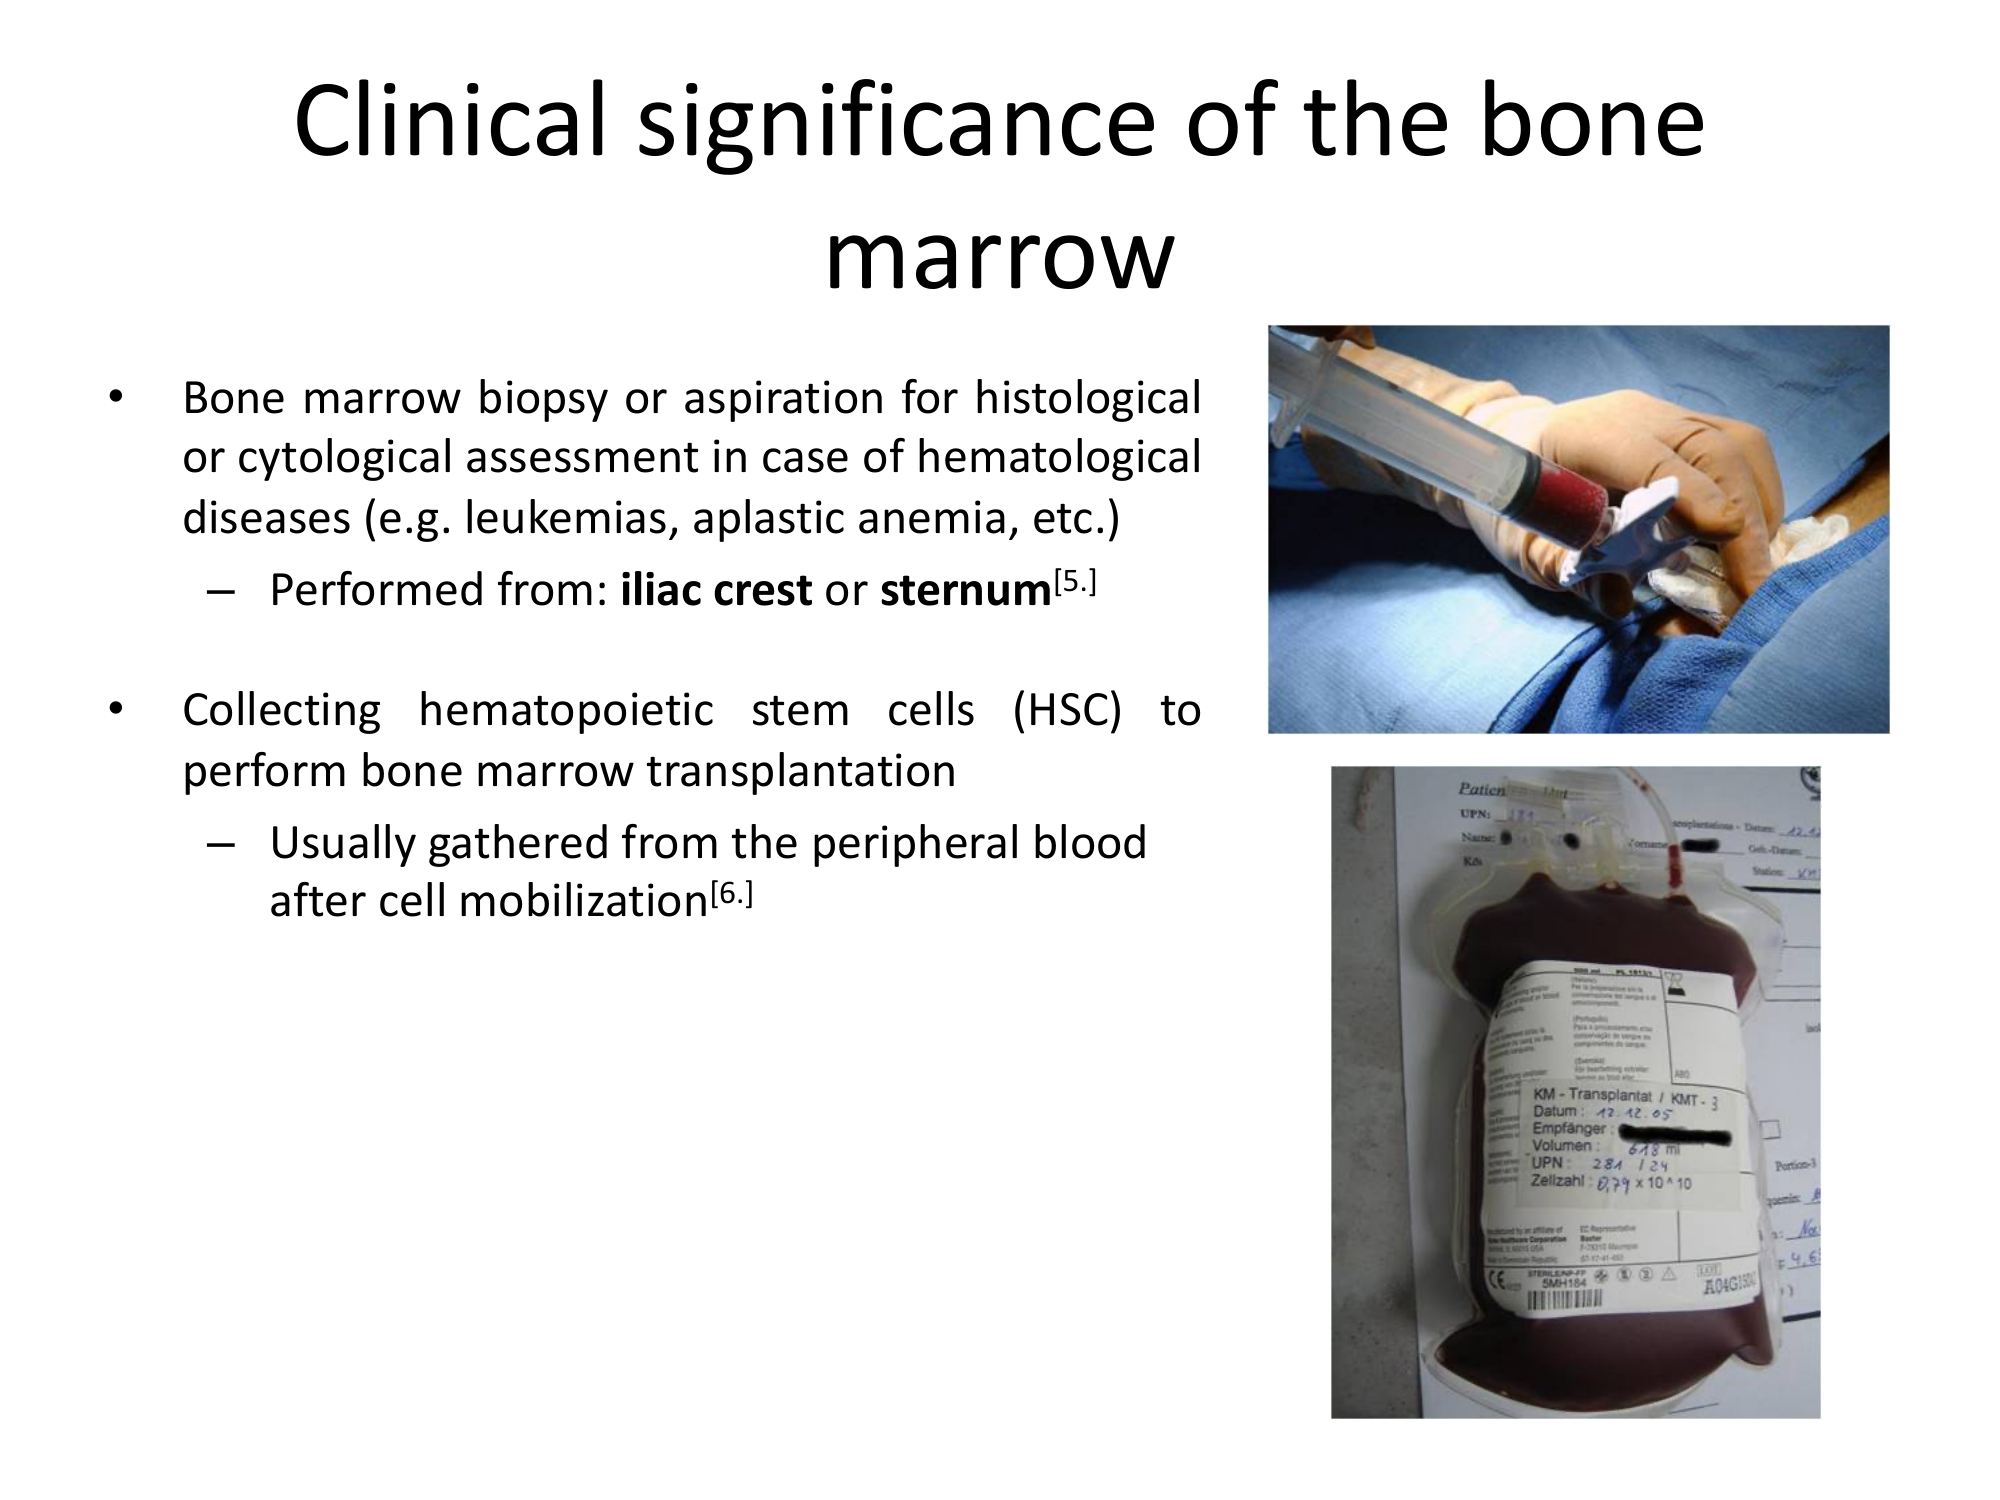
Clinical Significance of Bone Marrow — Biopsy & HSC

Clinical biopsy photos and HSC collection information with mixed image quality. The redesign presents clinical images with clean framing, labeled annotations, and consistent styling.

Before
Before: Original slide 15 — clinical biopsy photos
Mixed-quality clinical photos, inconsistent framing
After
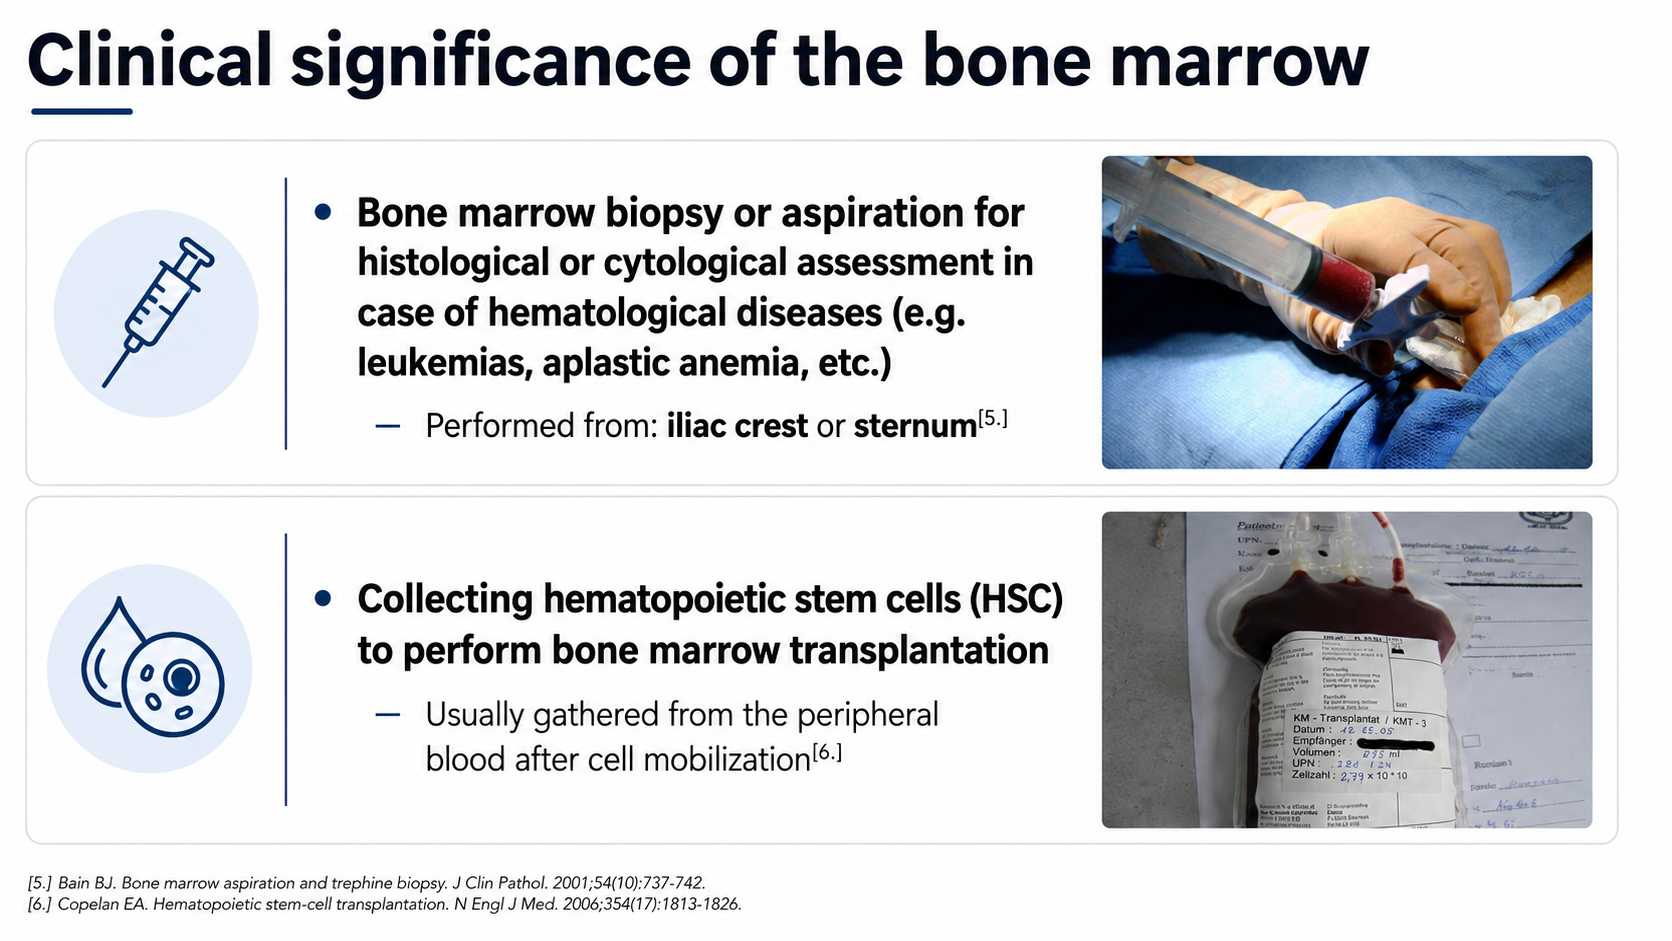
After: Redesigned slide 15 with clean clinical image presentation
Clean clinical image presentation with labeled annotations and consistent framing
16

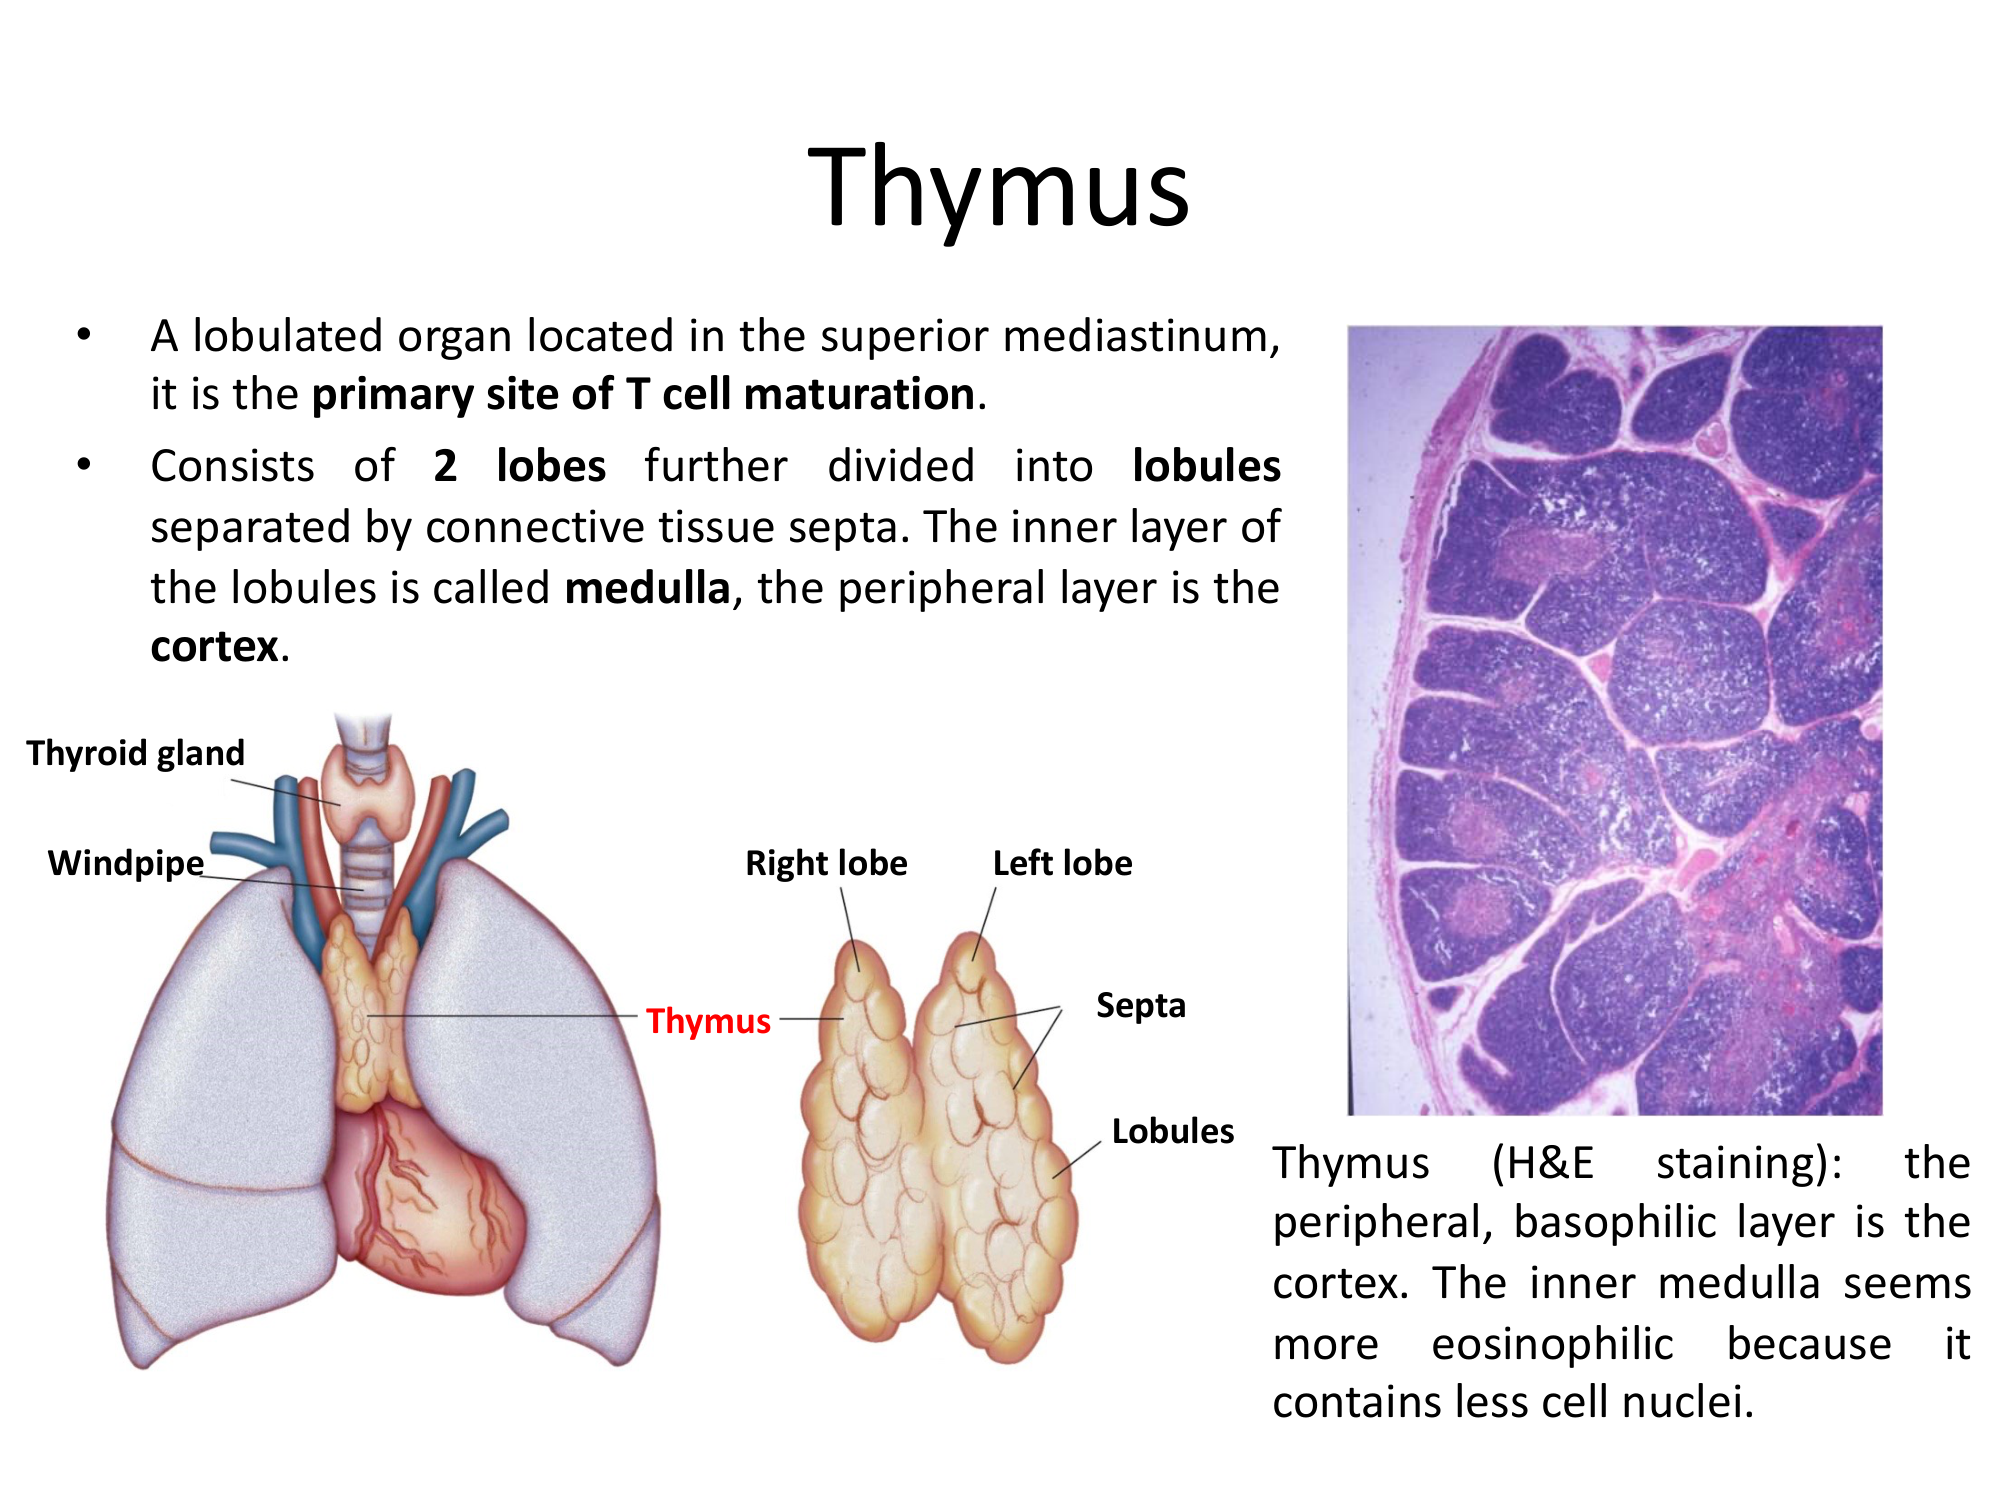
Thymus — Organ Illustration & H&E Staining

A thymus organ illustration with H&E staining microscopy from mixed sources. The redesign generates a precise AI illustration of thymus lobes alongside properly framed histology with labeled cortex and medulla.

Before
Before: Original slide 16 — thymus illustration and H&E microscopy
Mixed-source thymus illustration and microscopy, inconsistent quality
After
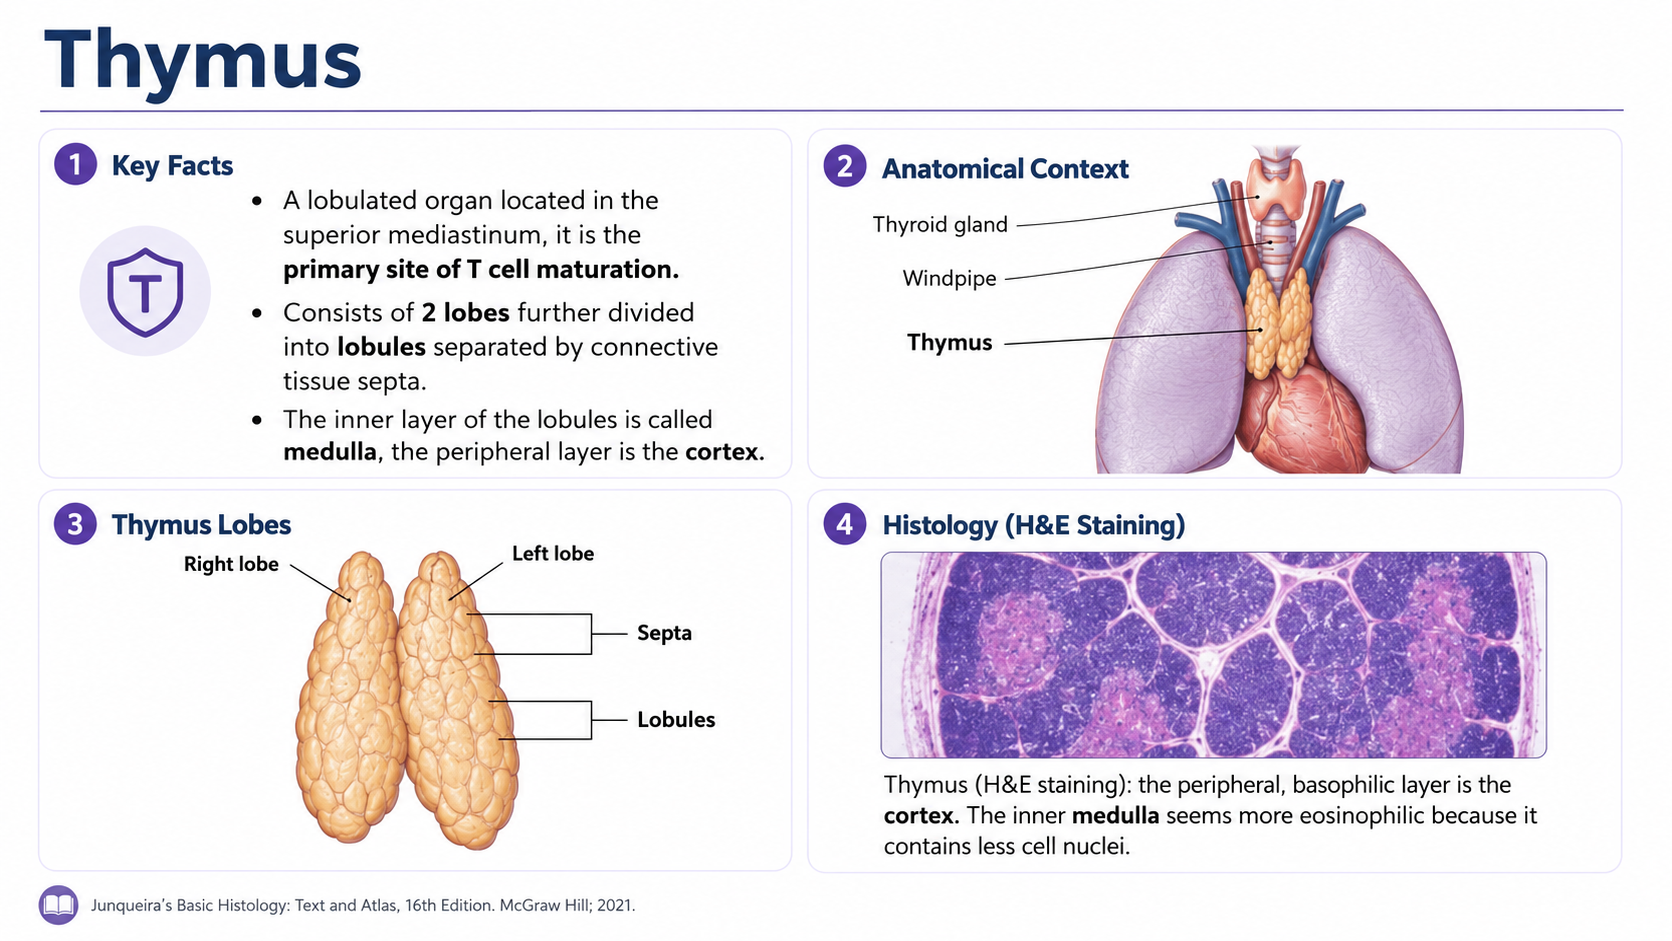
After: Redesigned slide 16 with AI-generated thymus illustration
AI-generated thymus lobe illustration with labeled cortex/medulla histology
17

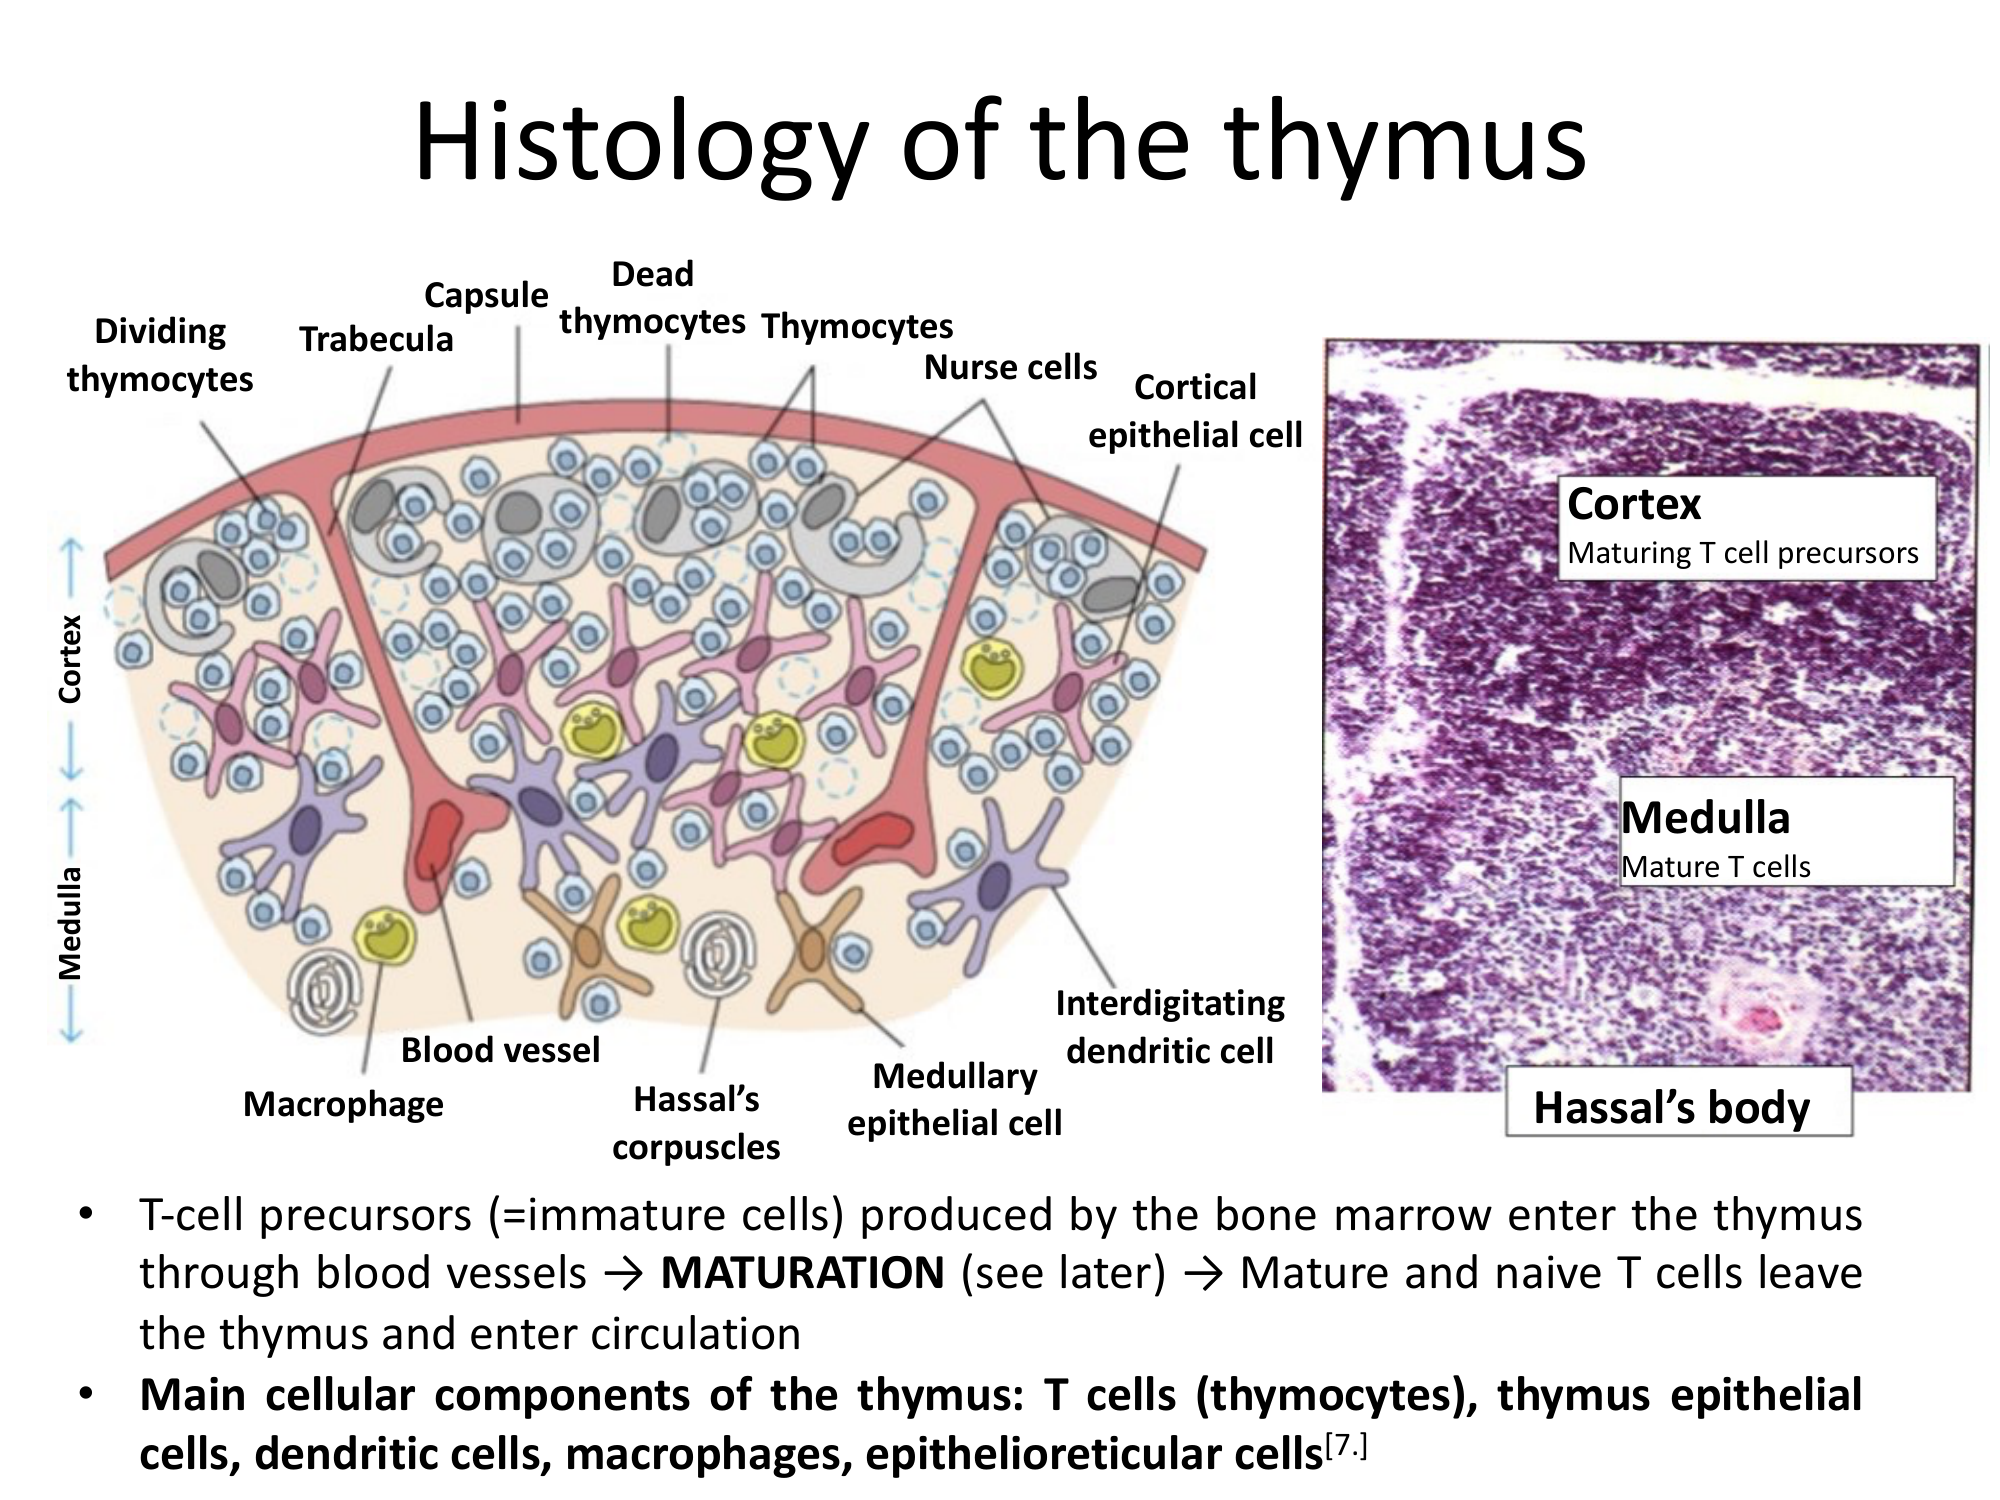
Histology of the Thymus — Detailed Cross-Section

Detailed thymus cross-section illustration with labeled cell types and microscopy. The redesign creates a clean AI-generated histological diagram with precise cell labeling and an integrated microscopy panel.

Before
Before: Original slide 17 — thymus cross-section with cell labels
Cluttered cross-section diagram with overlapping cell labels
After
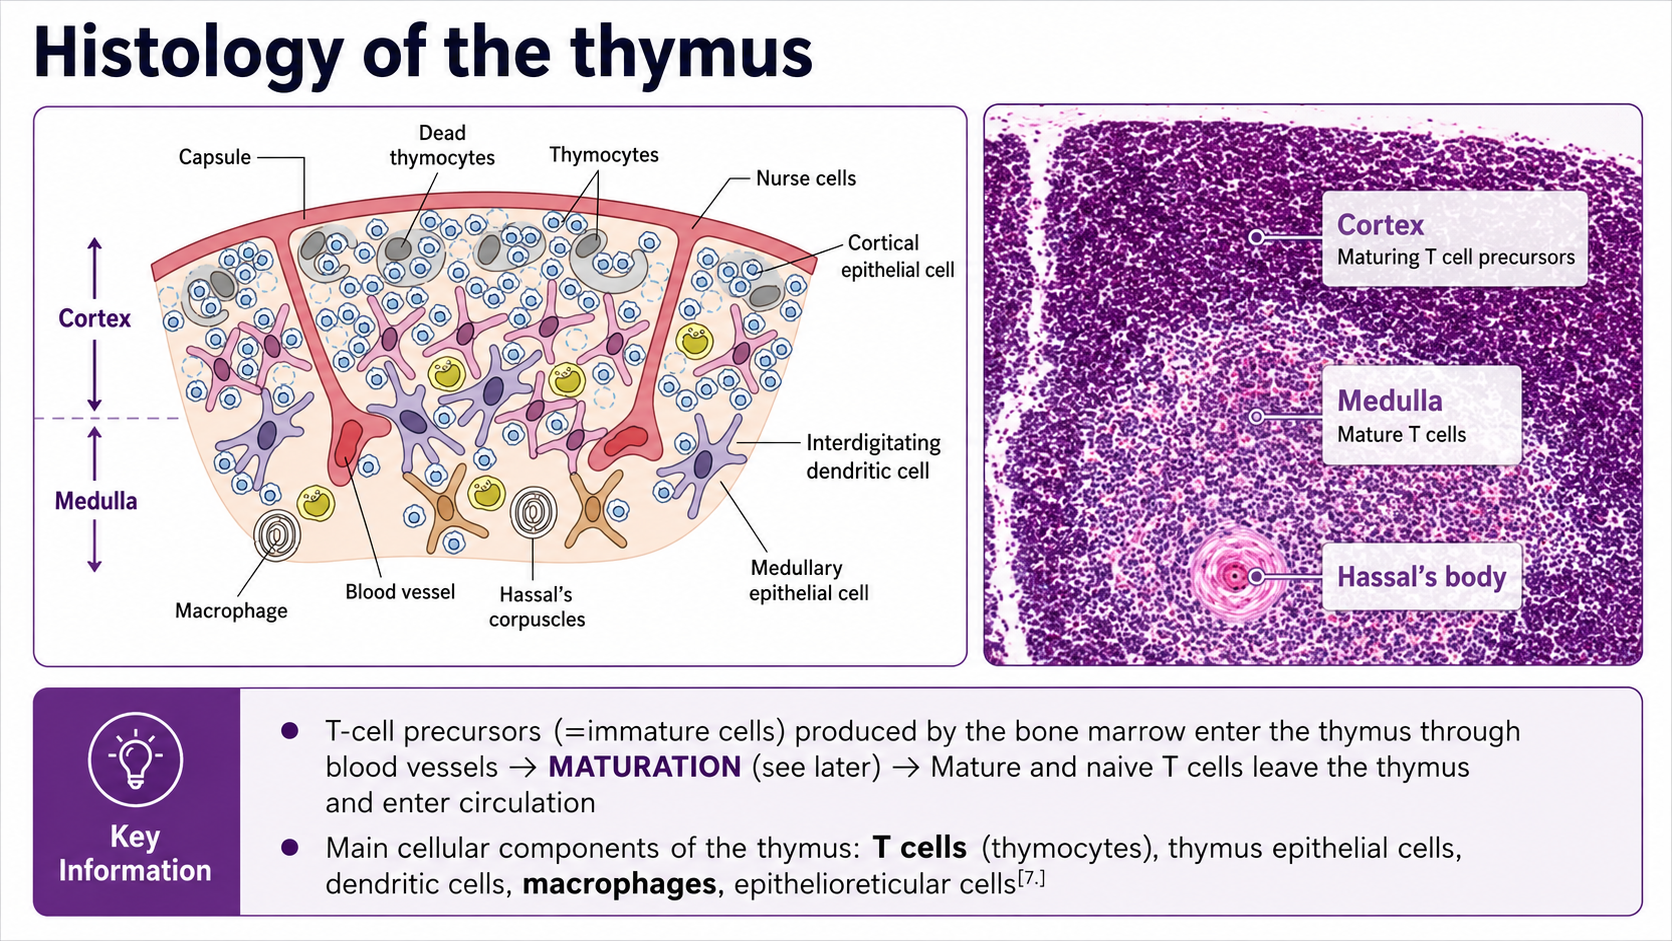
After: Redesigned slide 17 with AI-generated thymus histology diagram
AI-generated histological diagram with precise cell labeling and clean layout
18

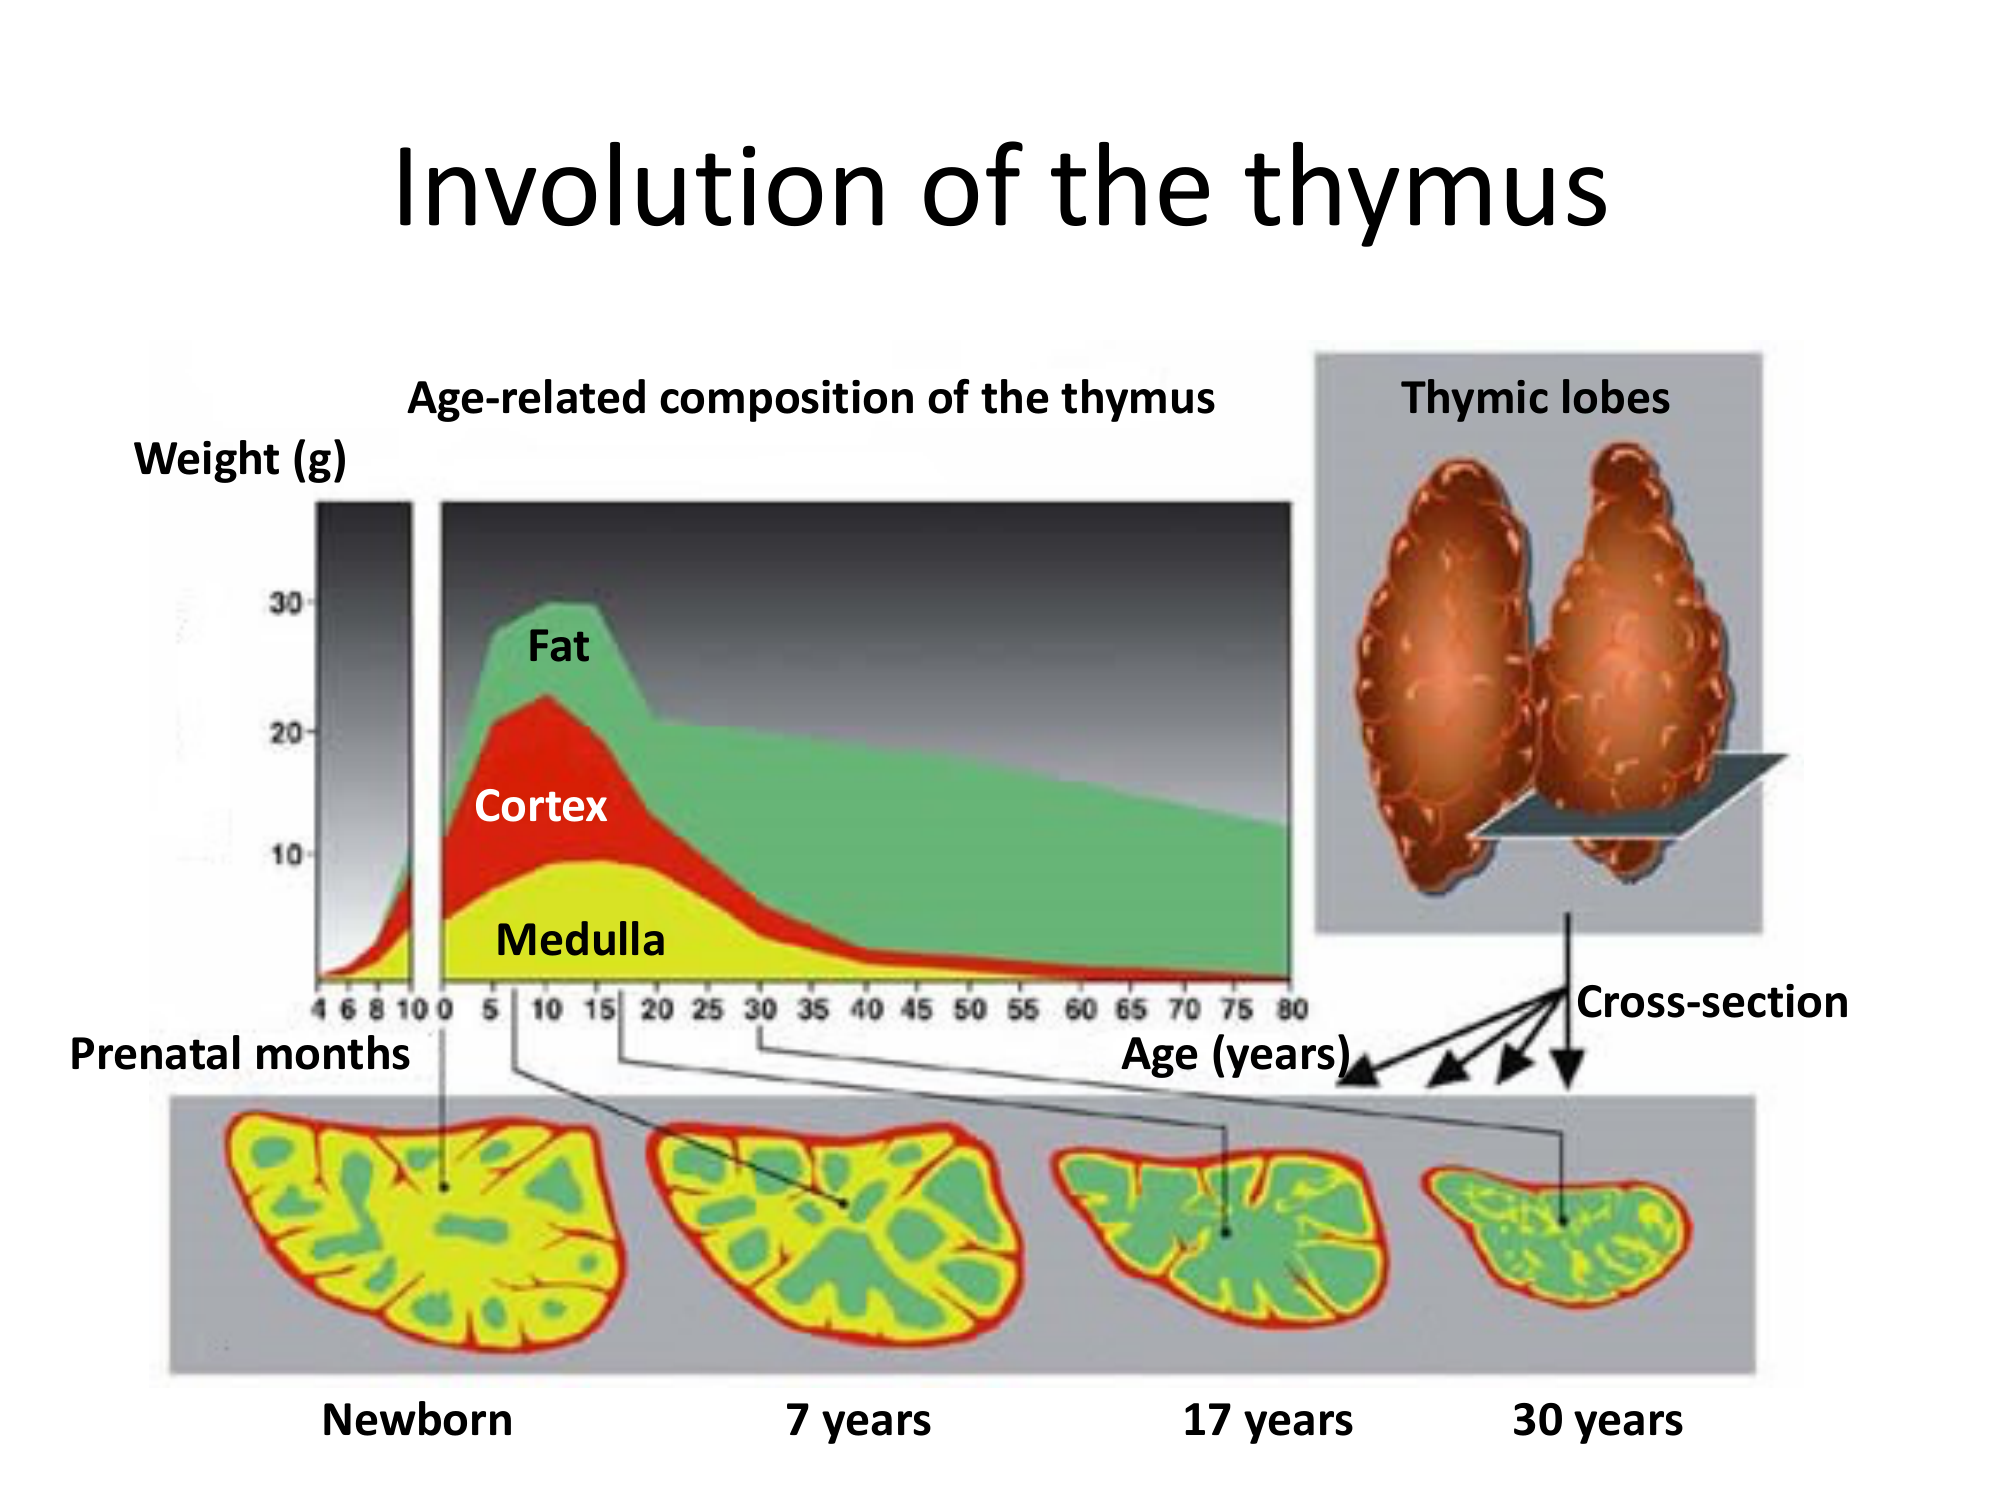
Involution of the Thymus — Age-Related Changes

Age-related thymus composition chart with cross-sections at different ages. The redesign produces a clear timeline visualization with AI-generated thymus illustrations showing progressive involution.

Before
Before: Original slide 18 — thymus involution chart and cross-sections
Age-composition chart with basic cross-section images, cluttered layout
After
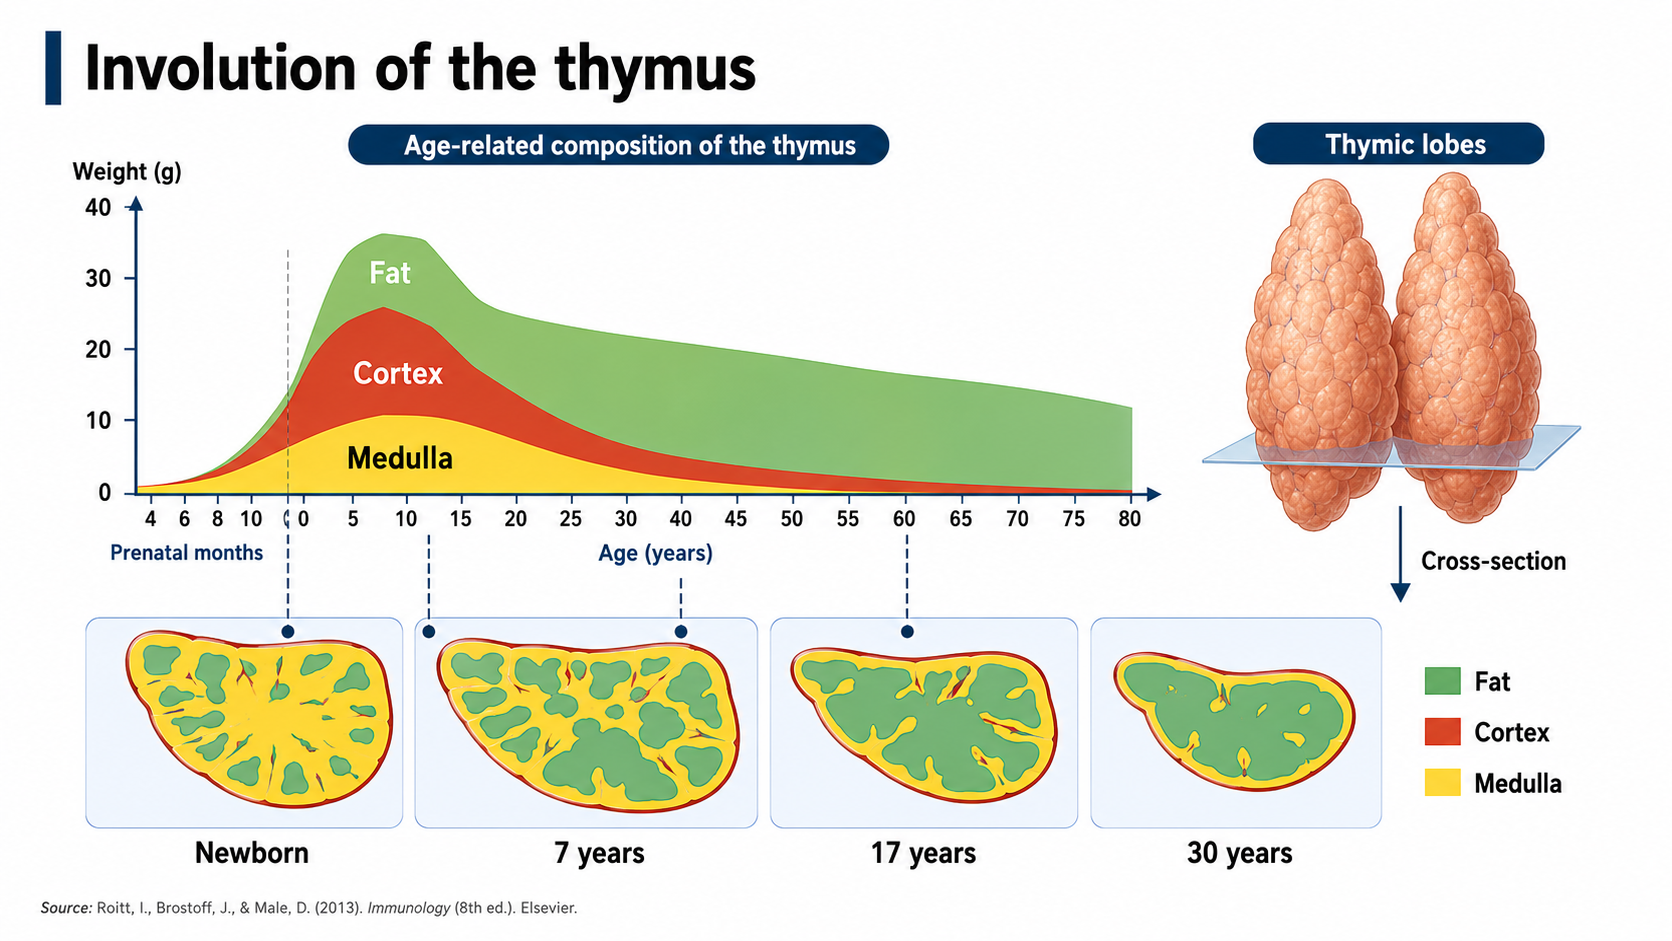
After: Redesigned slide 18 with timeline of thymus involution
Timeline visualization with AI-generated thymus illustrations showing progressive involution
19

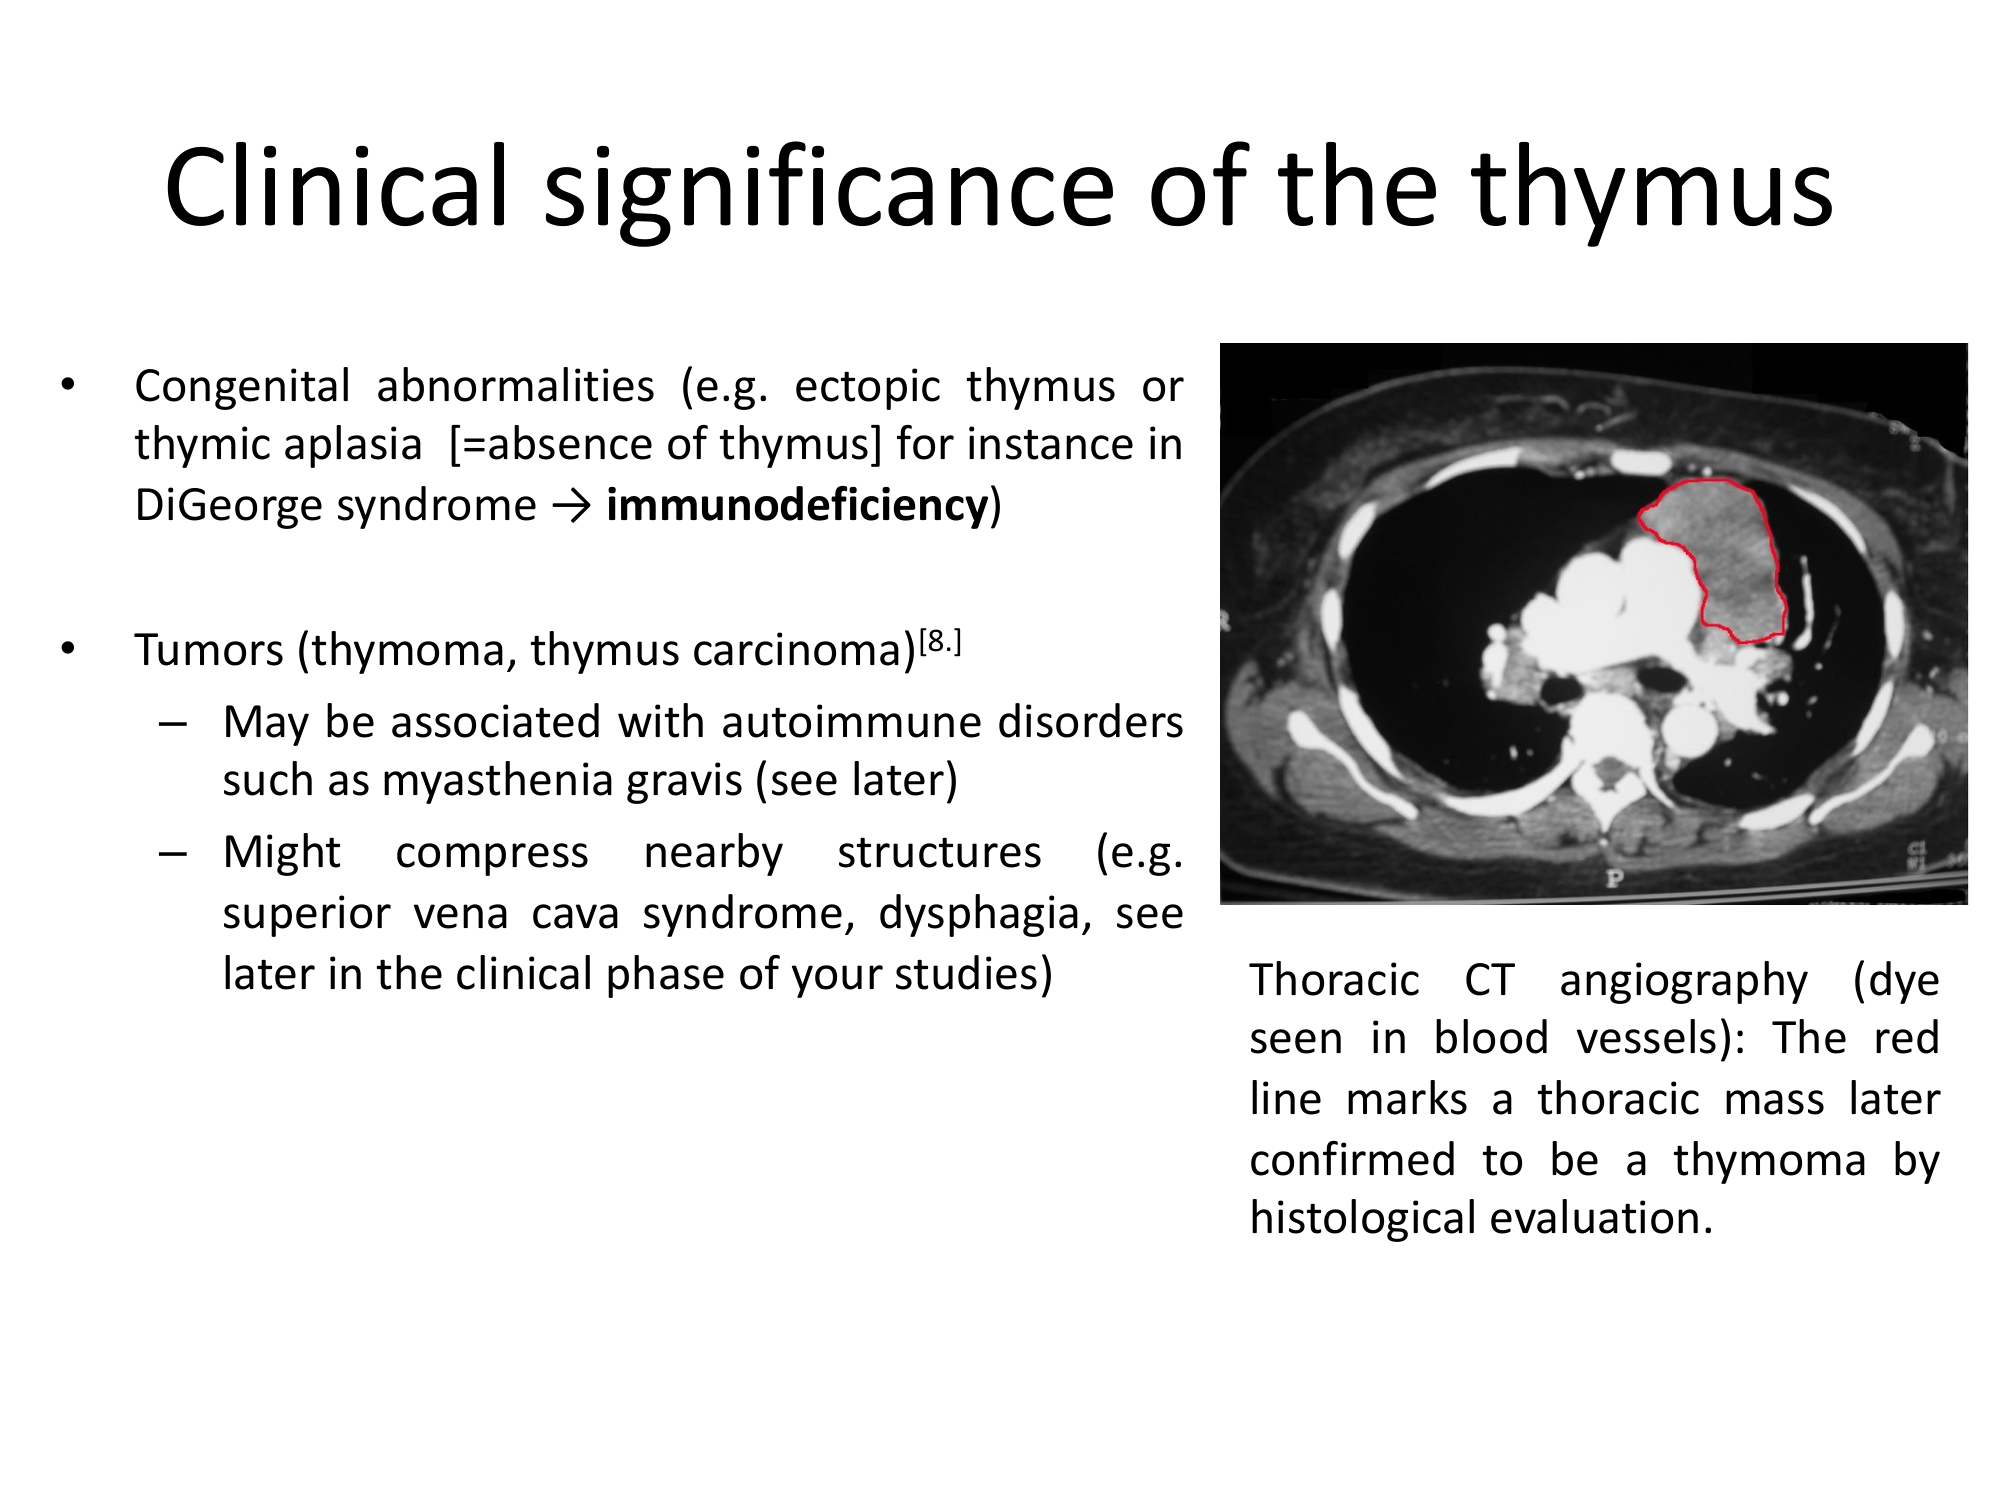
Clinical Significance of the Thymus — CT & Thymoma

CT angiography and thymoma clinical images with minimal context. The redesign presents clinical imaging with clean annotation overlays and diagnostic context.

Before
Before: Original slide 19 — CT and thymoma clinical images
CT scans and thymoma images, minimal labeling and context
After
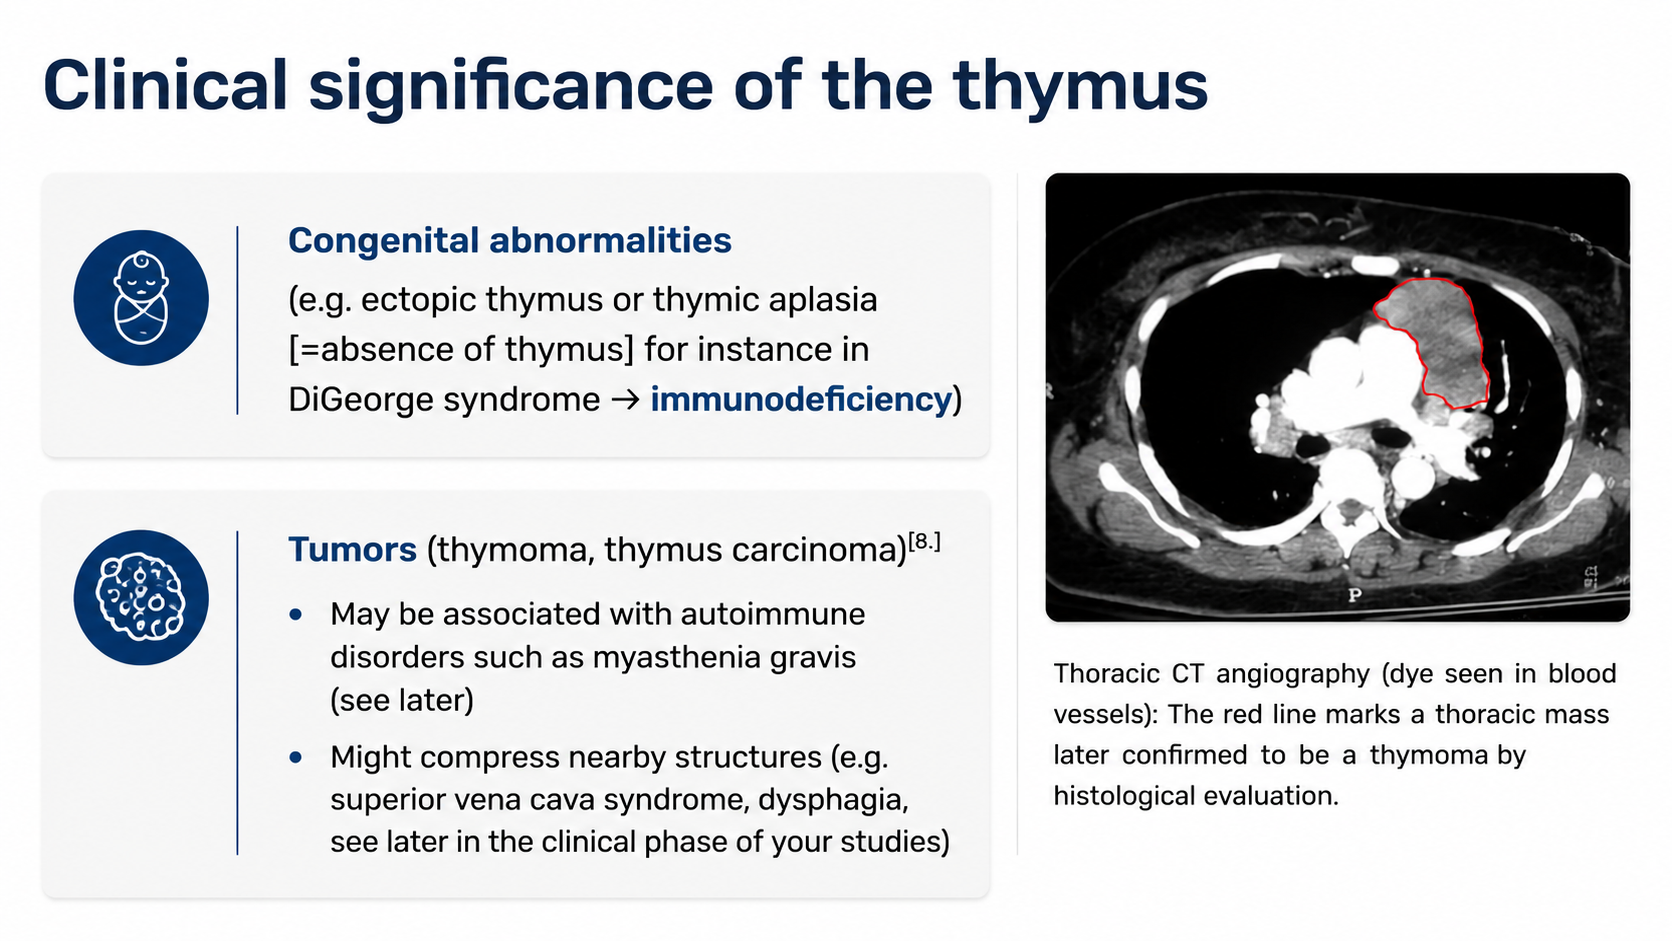
After: Redesigned slide 19 with annotated clinical imaging
Clean clinical imaging with annotation overlays and diagnostic context
20

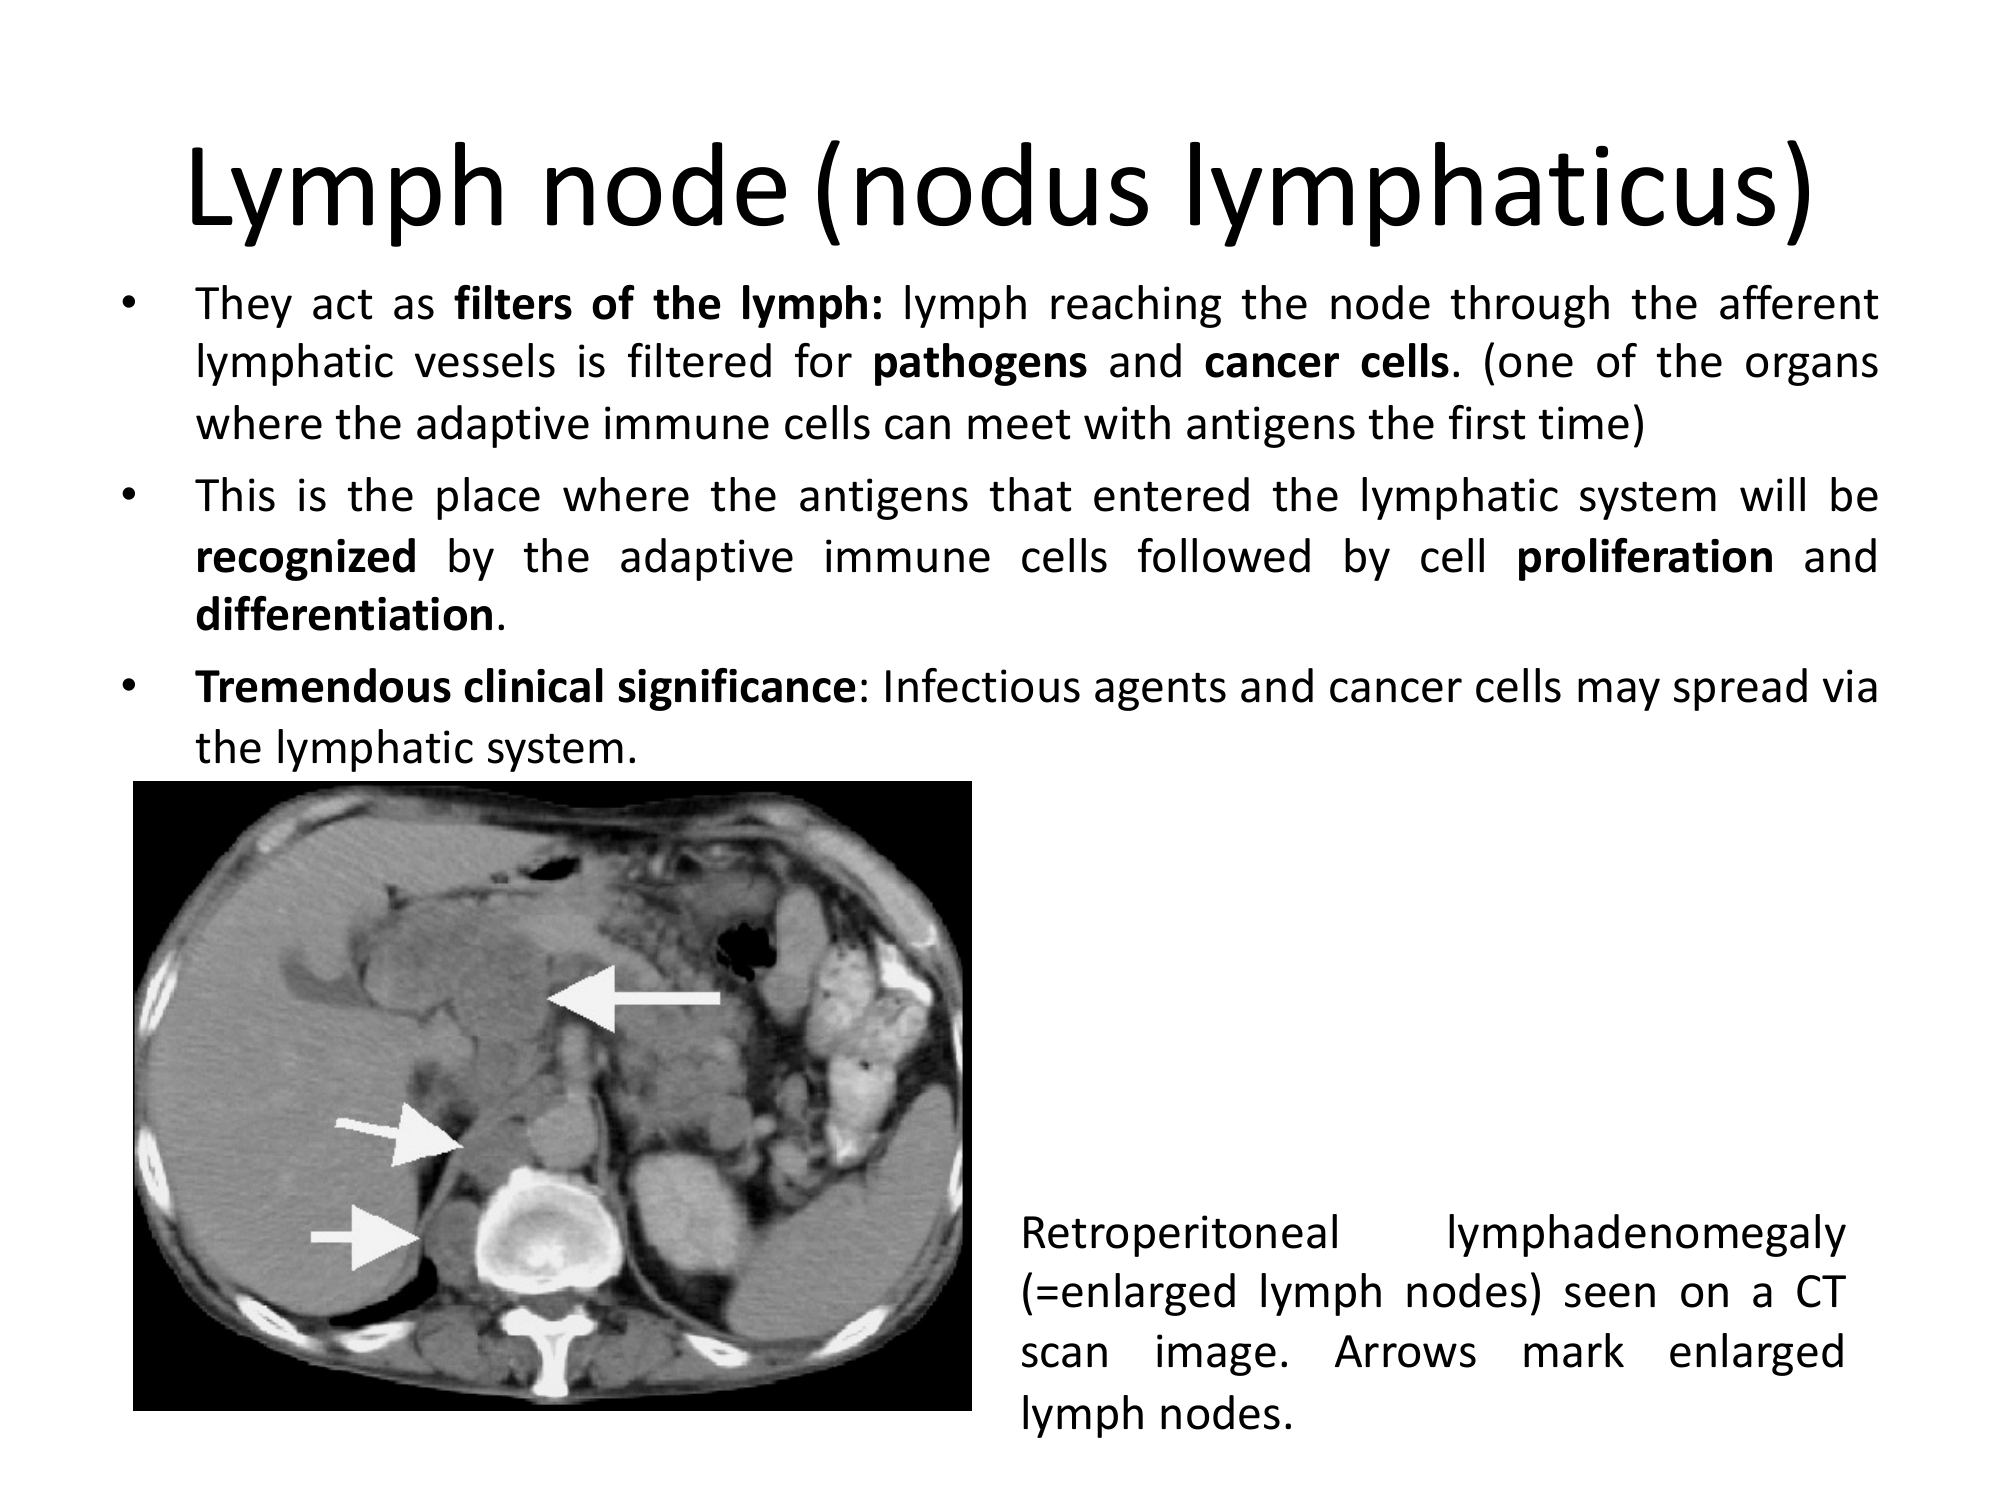
Lymph Node (Nodus Lymphaticus) — Function & CT Scan

Lymph node function description with a CT scan image. The redesign pairs a clean AI-generated lymph node illustration with properly framed clinical imaging.

Before
Before: Original slide 20 — lymph node text and CT scan
Text description with CT scan, no anatomical illustration
After
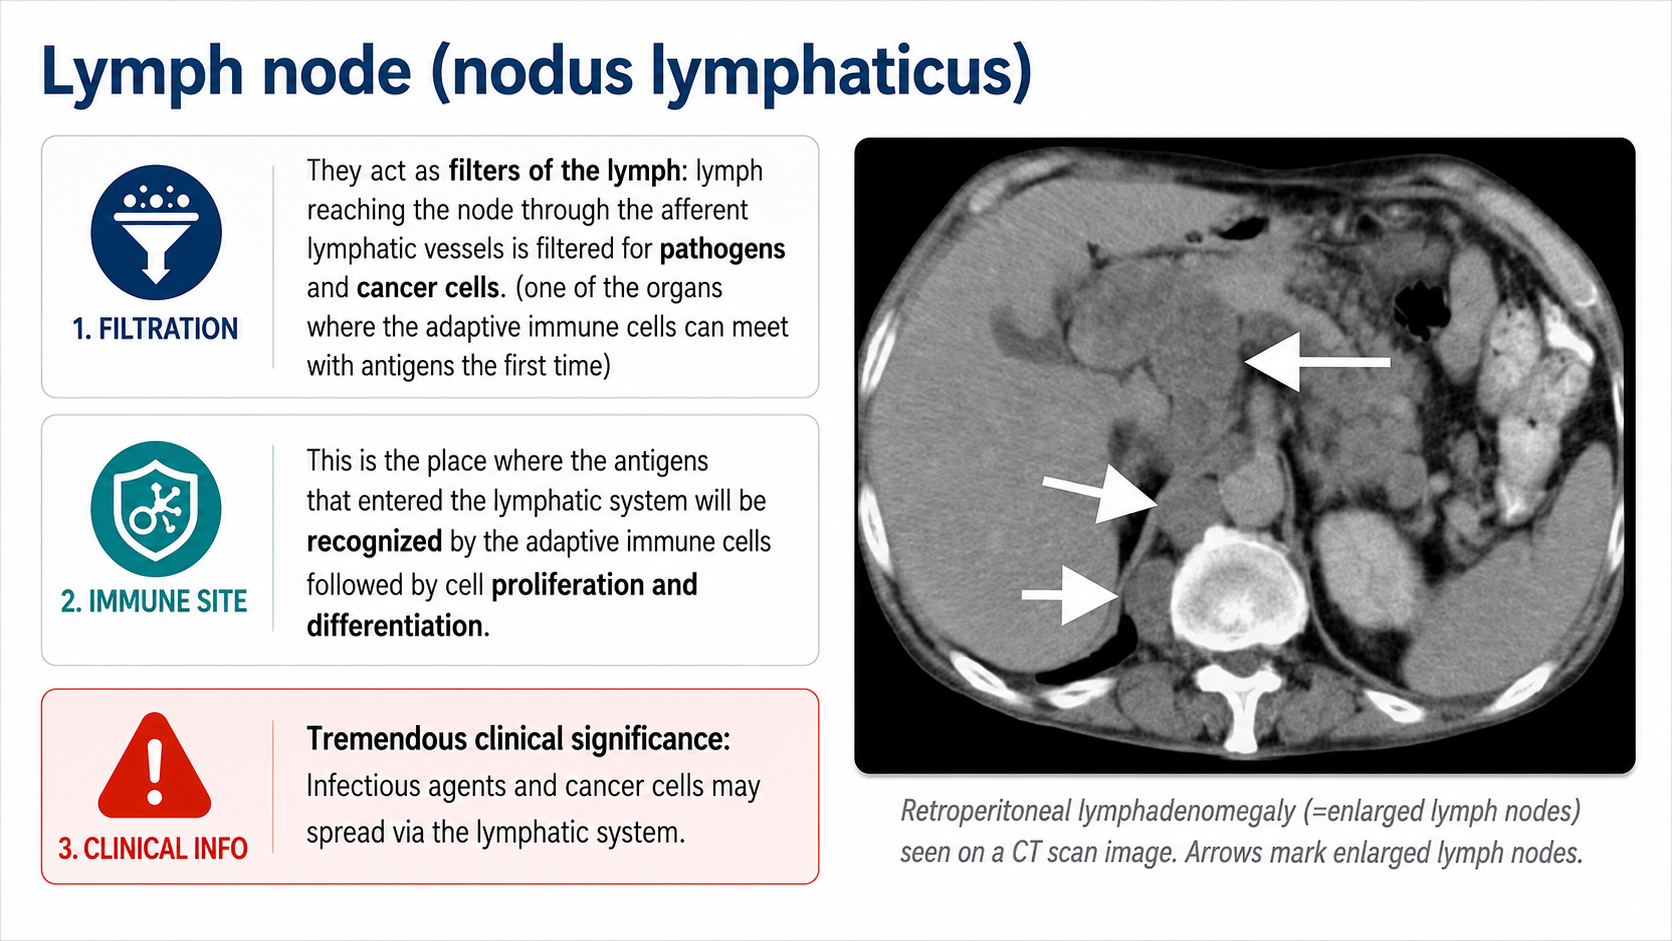
After: Redesigned slide 20 with AI-generated lymph node illustration
AI-generated lymph node illustration paired with properly framed clinical imaging
21

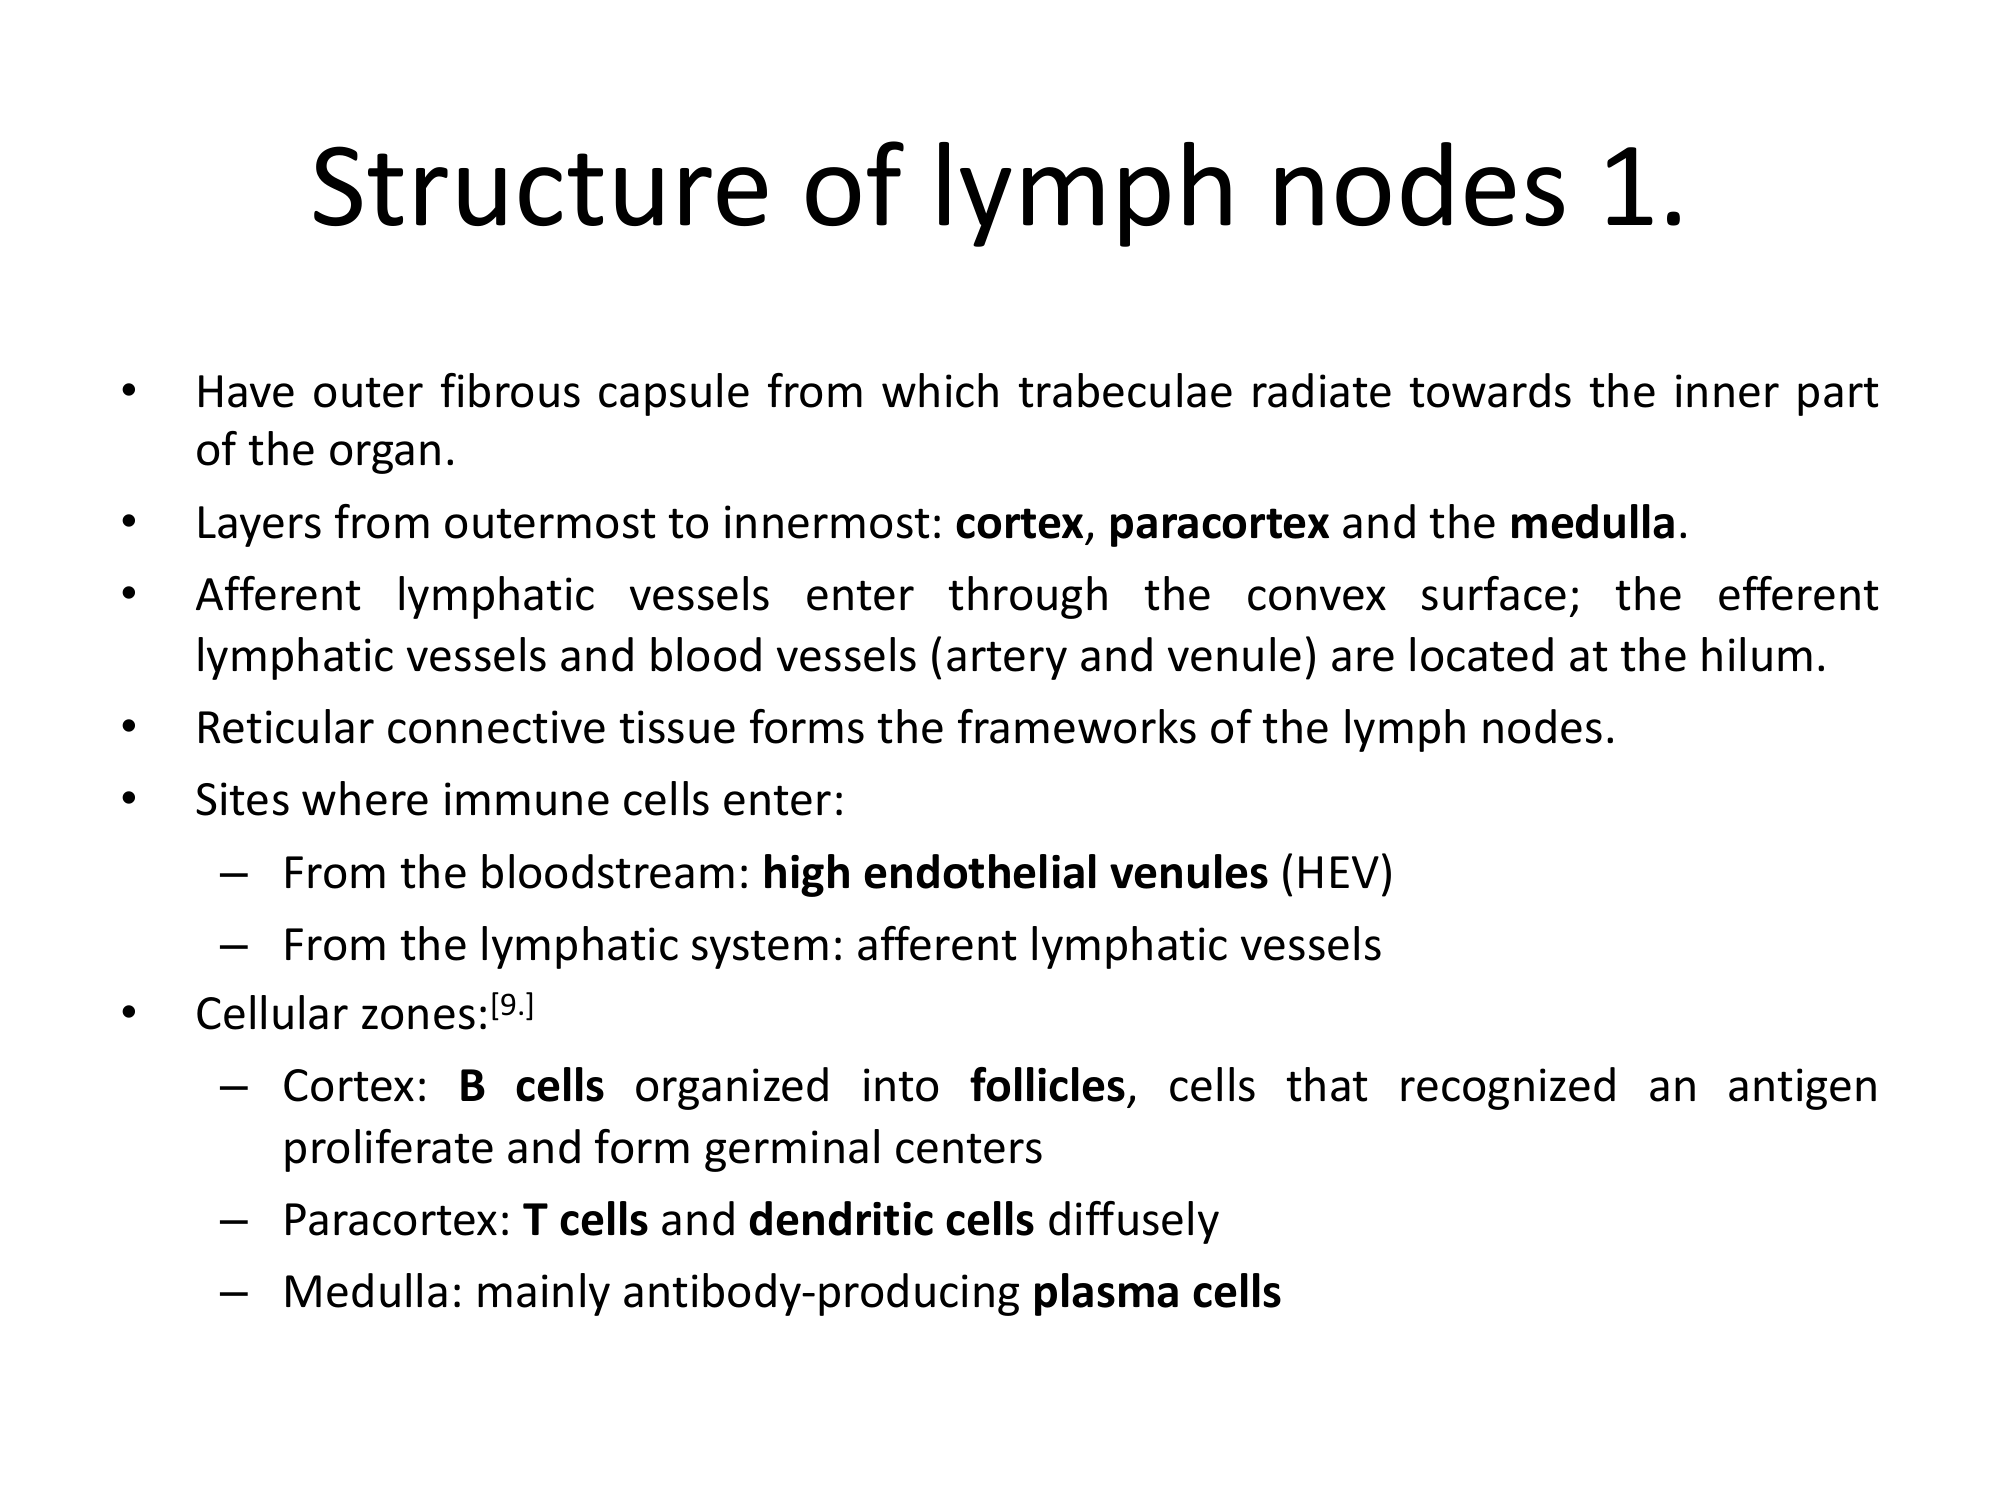
Structure of Lymph Nodes 1 — Zones & Organization

Text about lymph node capsule, zones, and cellular organization. The redesign transforms the text into a labeled AI-generated diagram showing cortex, paracortex, and medulla zones.

Before
Before: Original slide 21 — text about lymph node zones
Dense text describing lymph node zones, no diagram
After
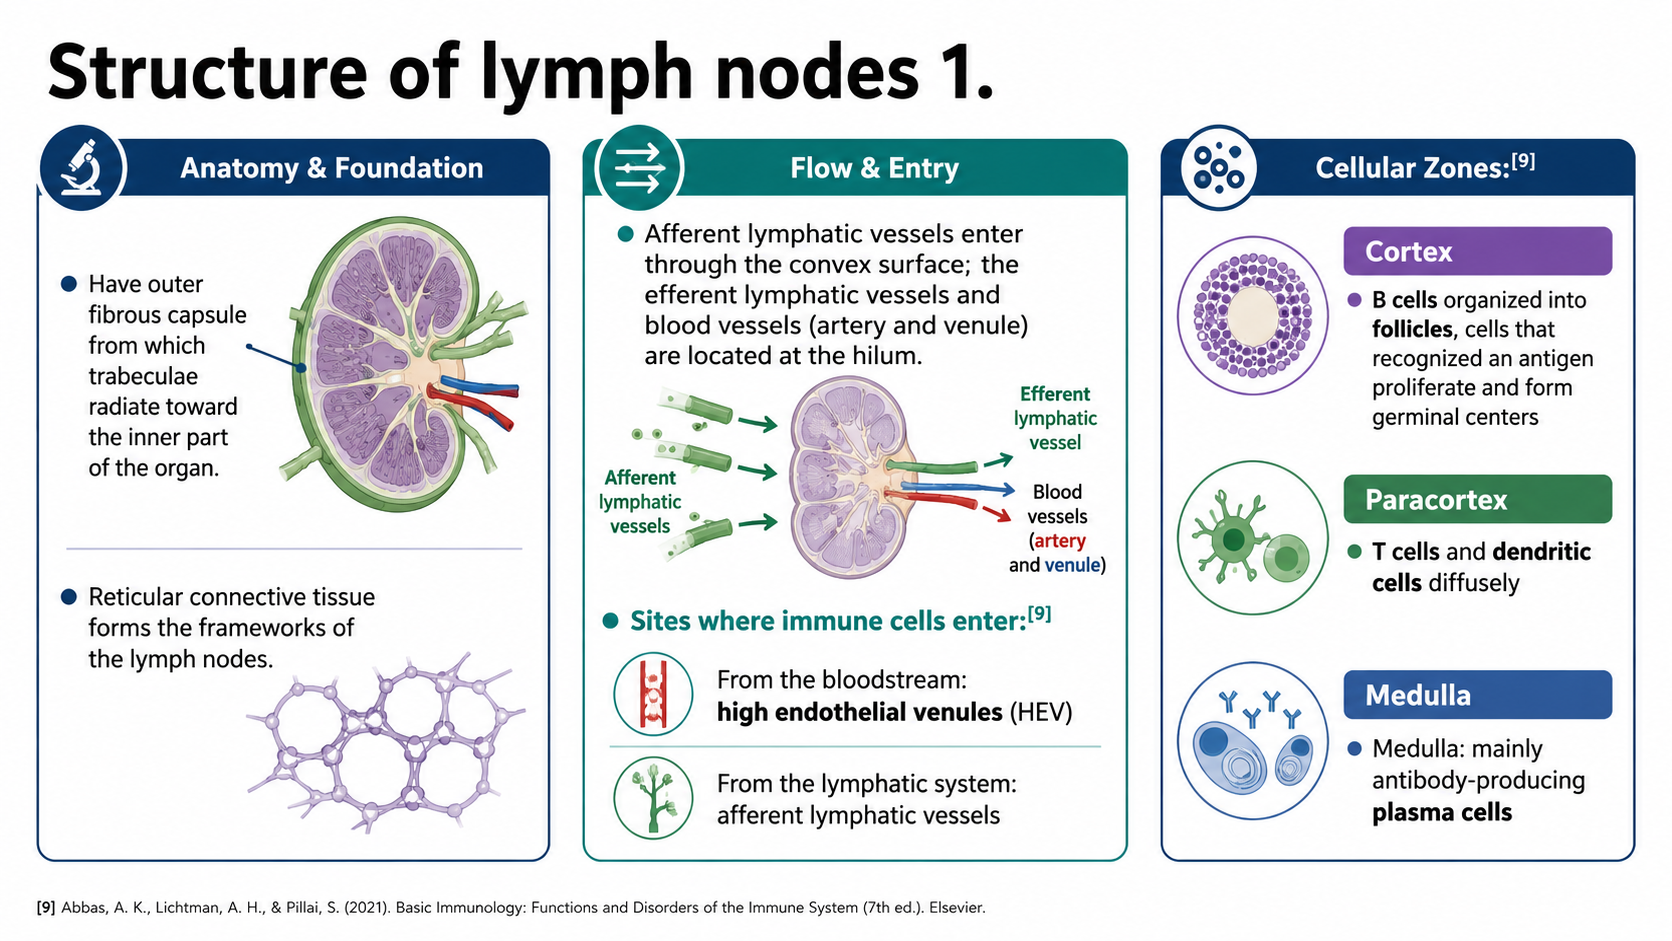
After: Redesigned slide 21 with AI-generated lymph node zone diagram
AI-generated diagram showing cortex, paracortex, and medulla zones
22

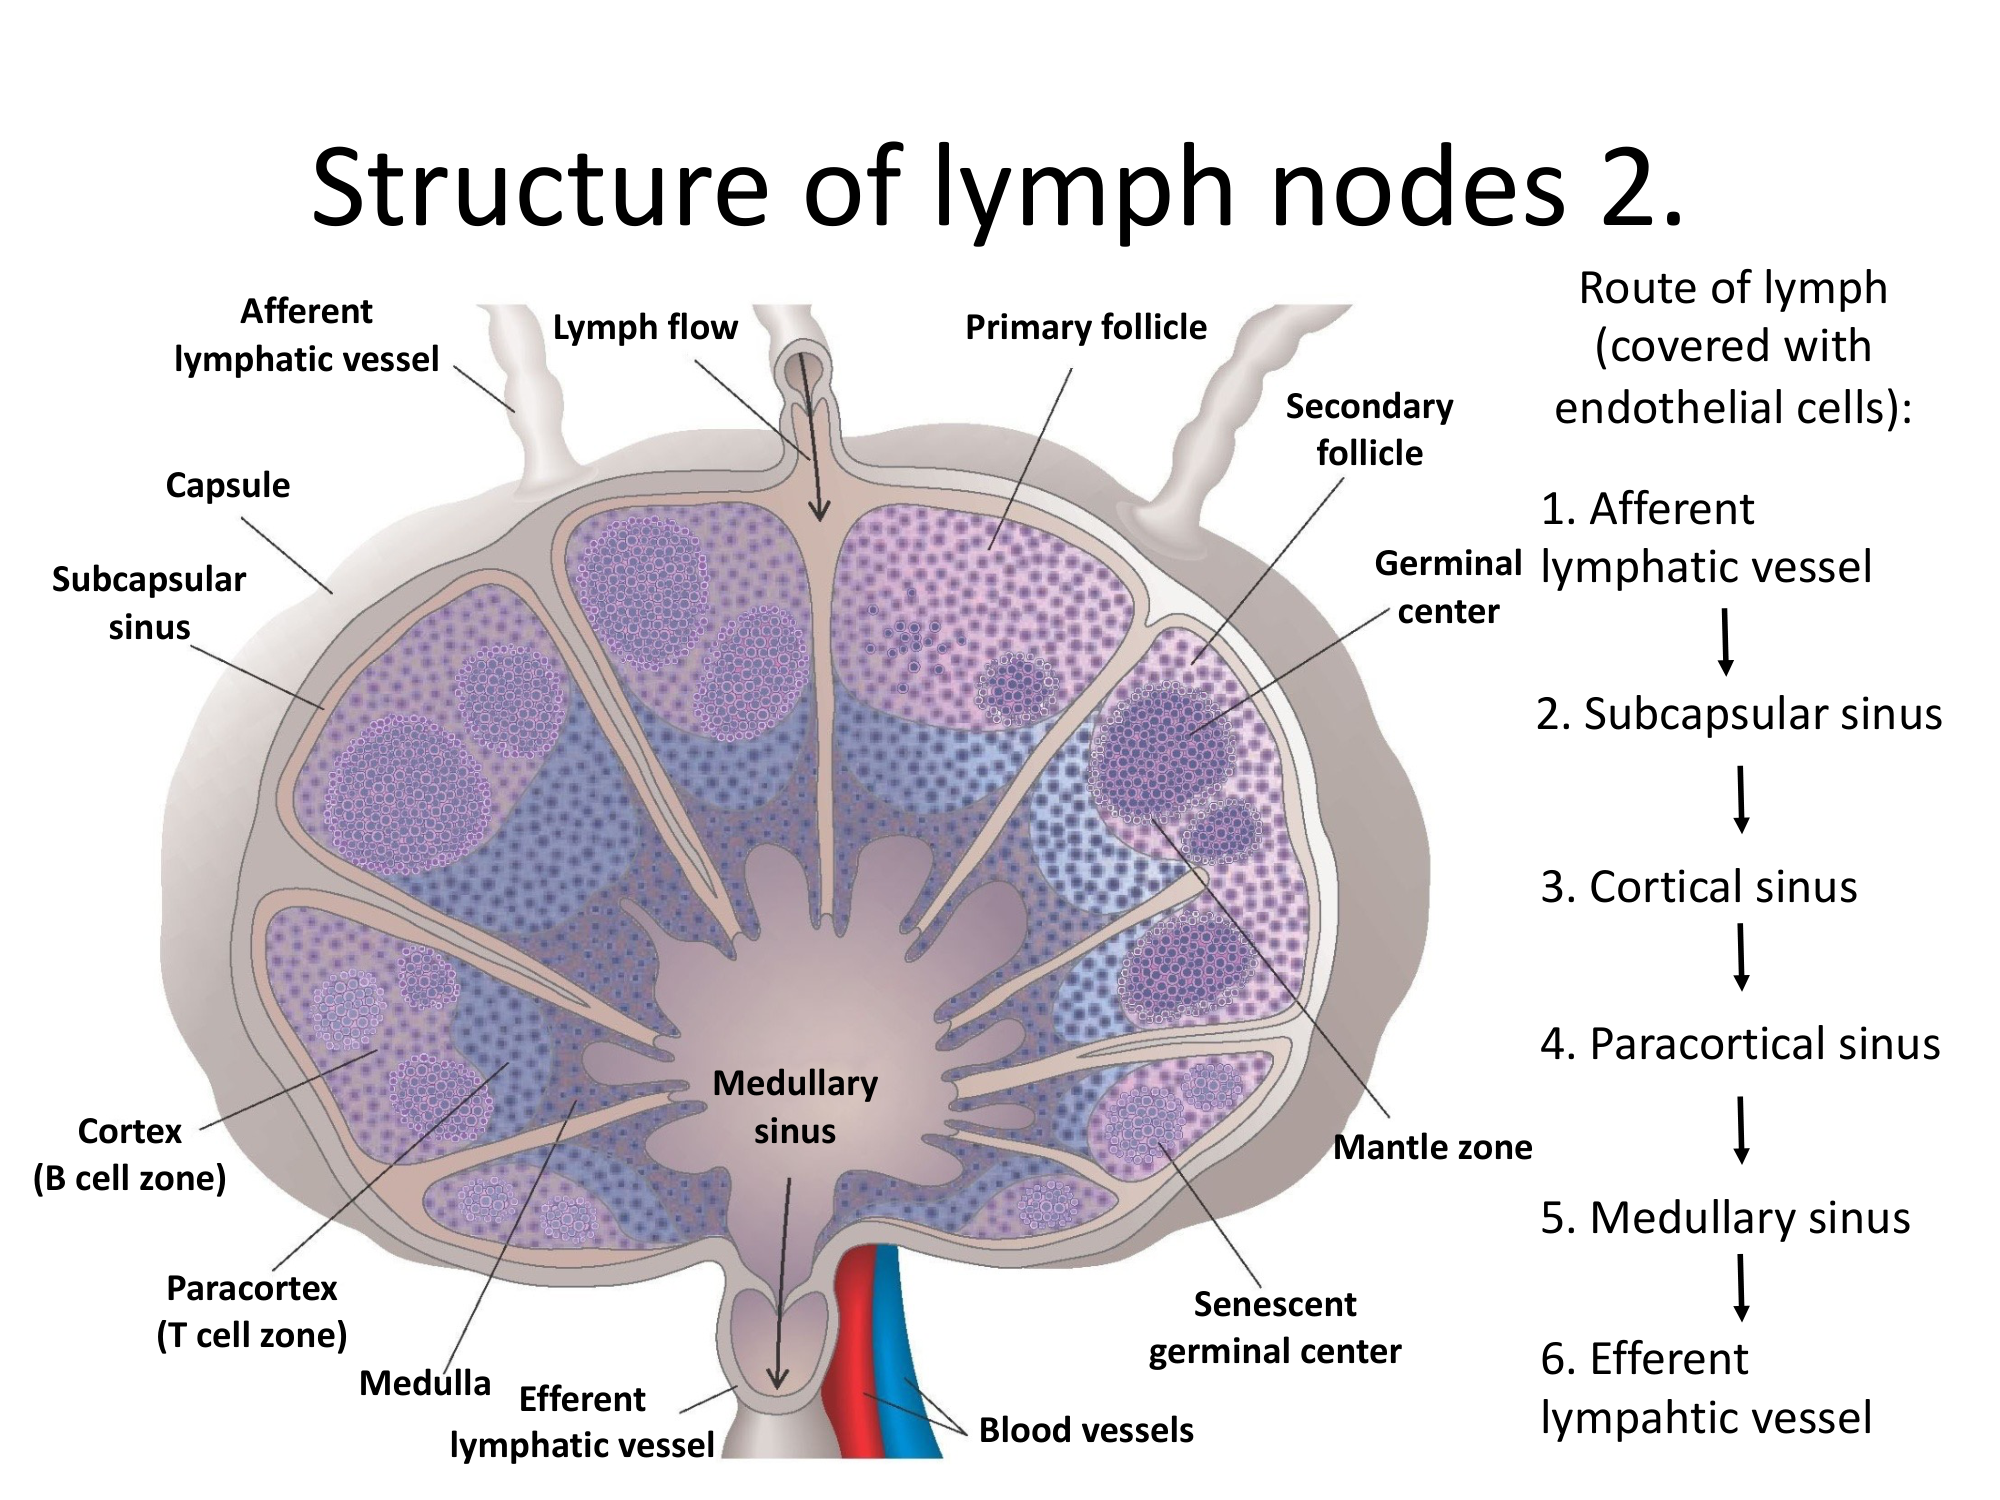
Structure of Lymph Nodes 2 — Detailed Cross-Section

A detailed cross-section diagram with all zones labeled. The redesign generates a precise AI anatomical cross-section with color-coded zones, afferent/efferent vessels, and clear annotations.

Before
Before: Original slide 22 — detailed lymph node cross-section
Textbook cross-section diagram, inconsistent labeling style
After
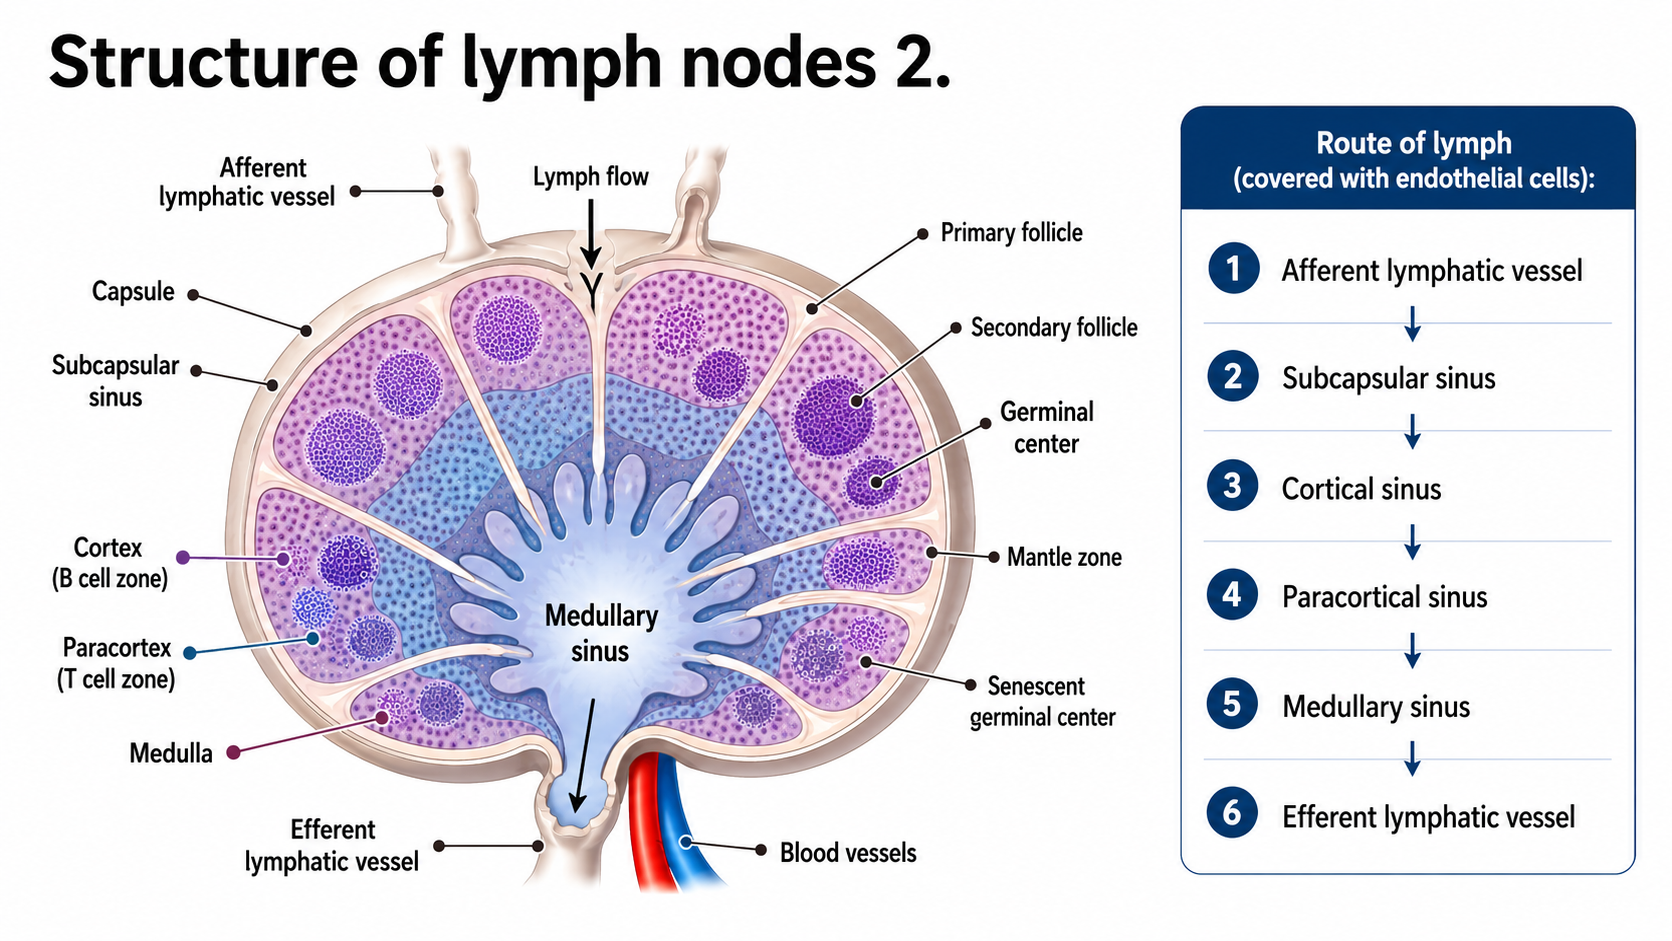
After: Redesigned slide 22 with AI-generated lymph node cross-section
AI-generated cross-section with color-coded zones and clear vessel annotations
23

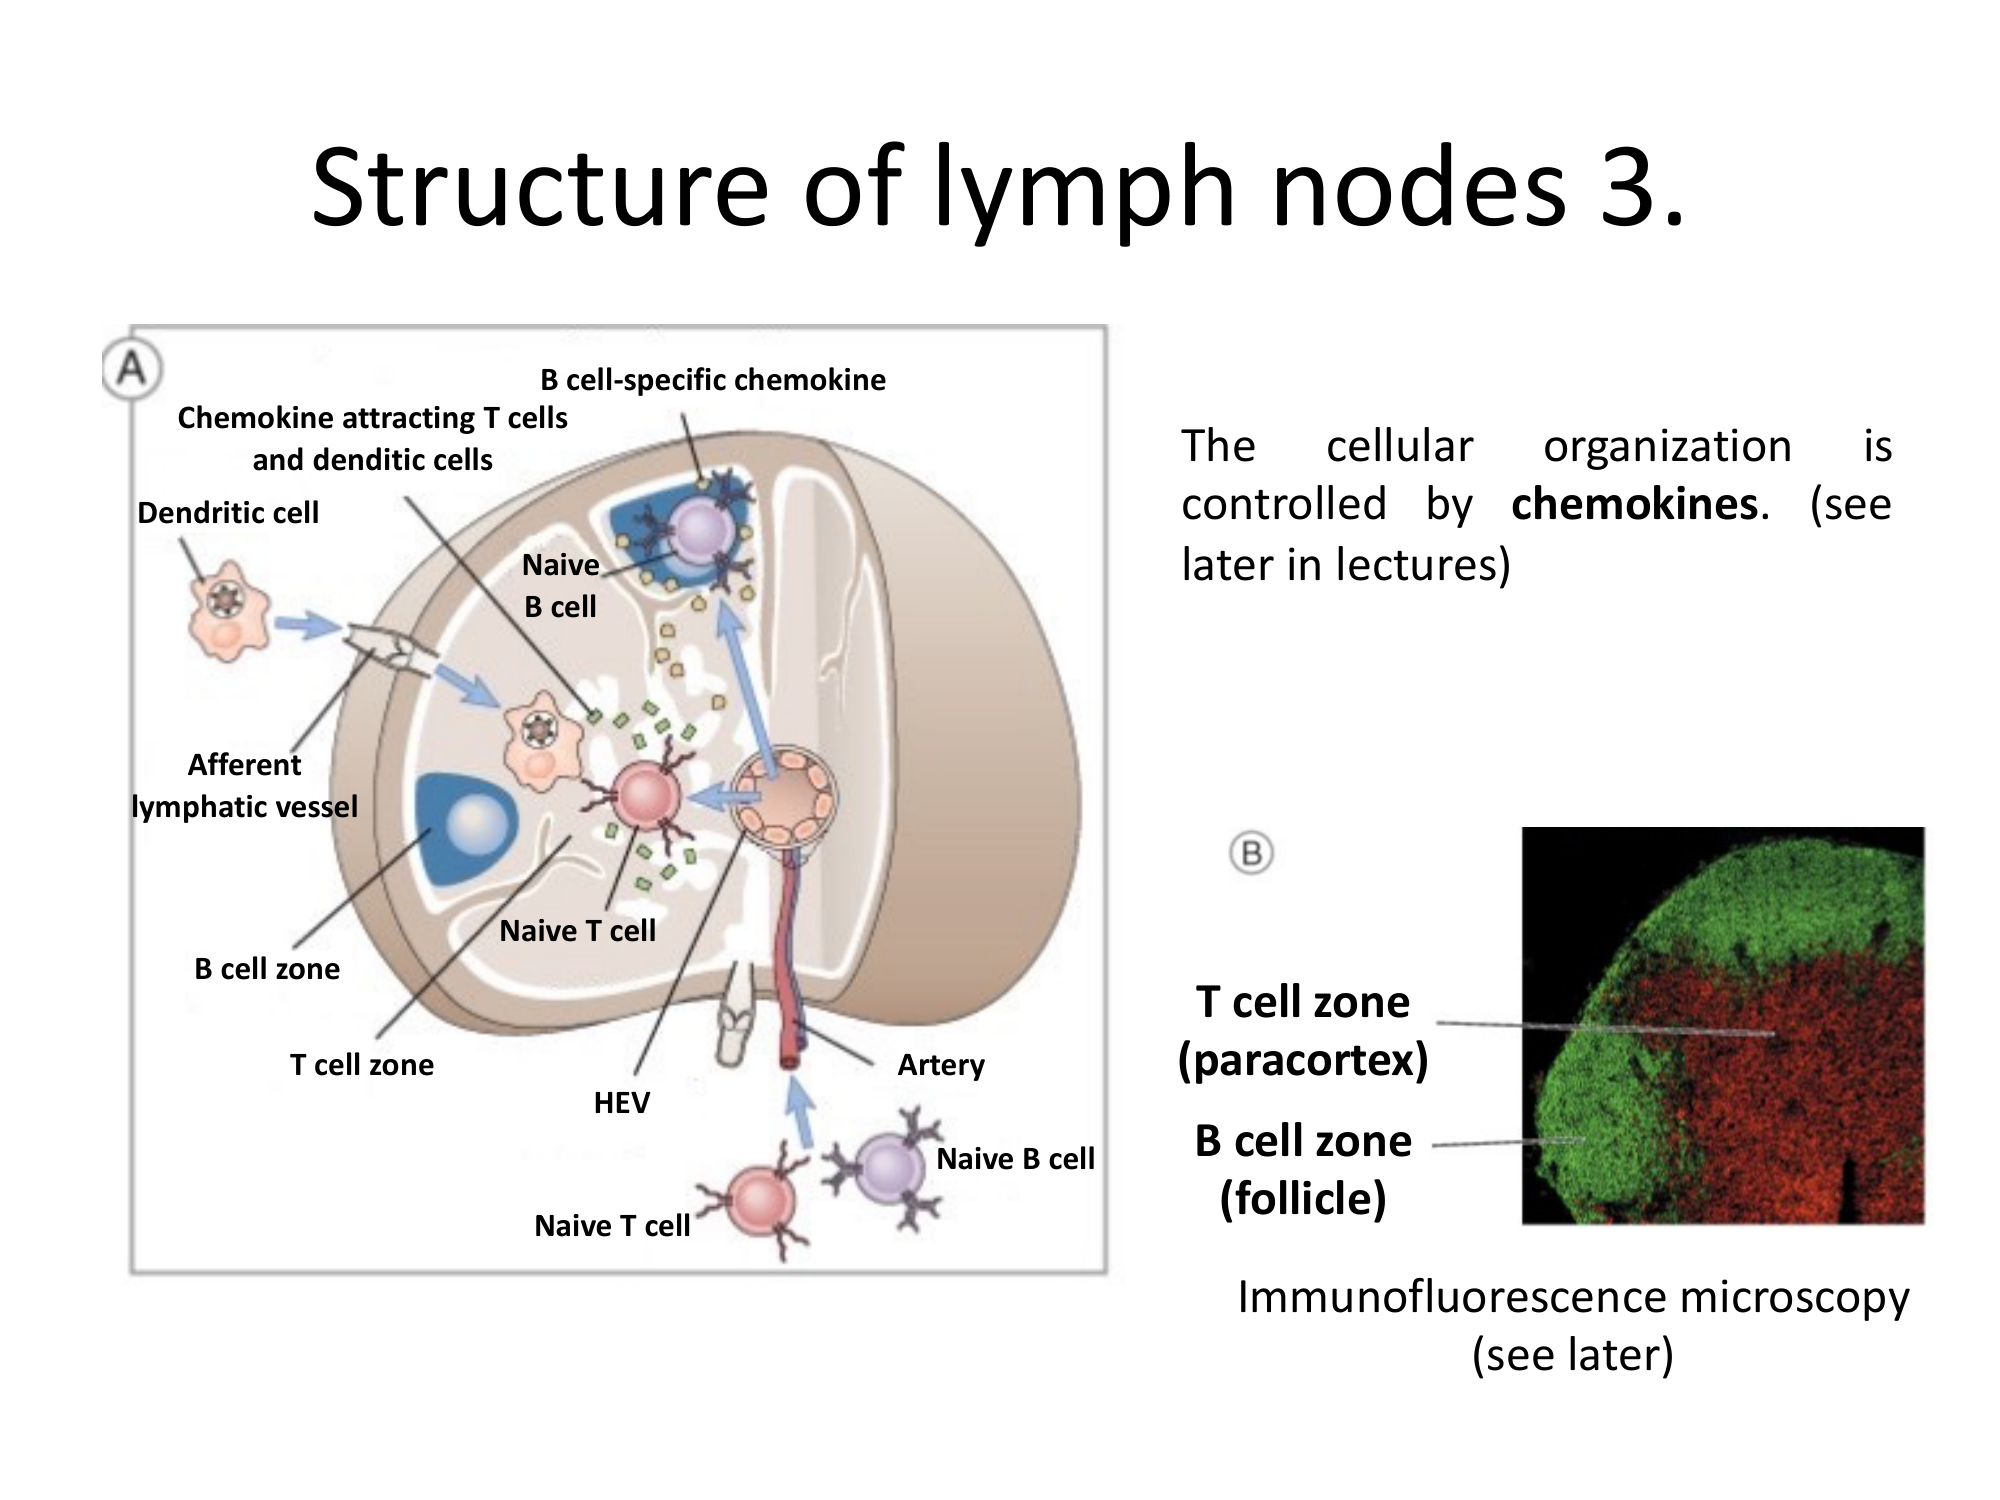
Structure of Lymph Nodes 3 — Chemokines & Immunofluorescence

Cellular diagram with chemokine signaling and immunofluorescence microscopy. The redesign creates an integrated layout with AI-generated cell migration diagrams and properly framed fluorescence imaging.

Before
Before: Original slide 23 — chemokine diagram and immunofluorescence
Cluttered cellular diagram with immunofluorescence image, overlapping elements
After
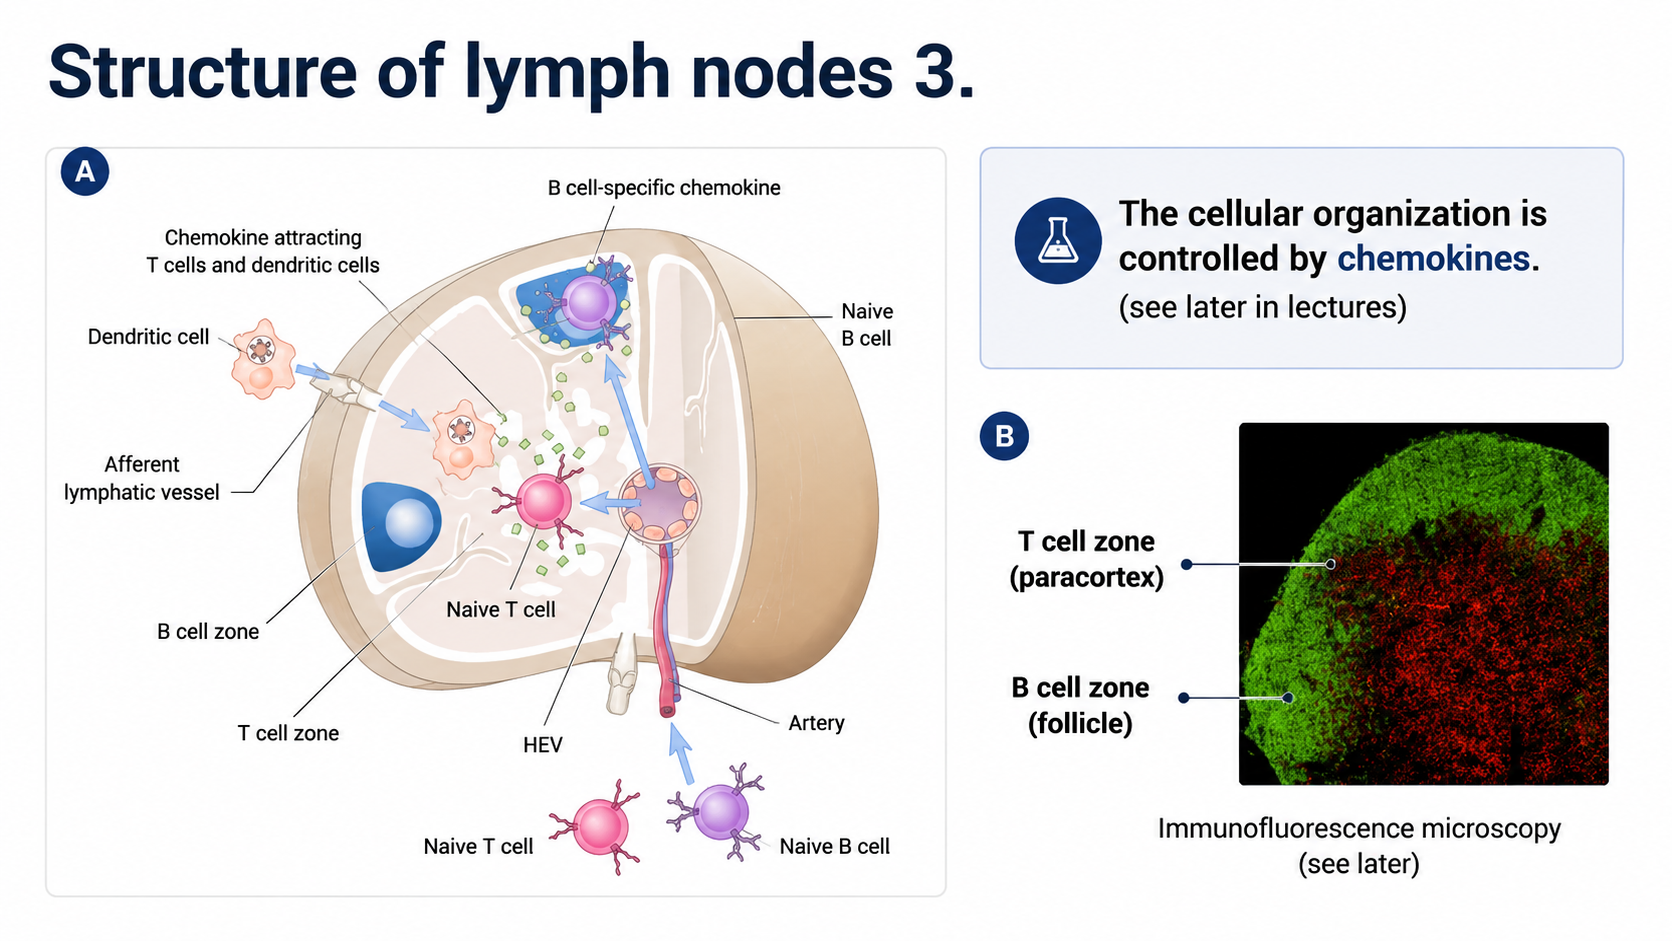
After: Redesigned slide 23 with AI cell migration diagram
AI-generated cell migration diagram with integrated fluorescence imaging
24

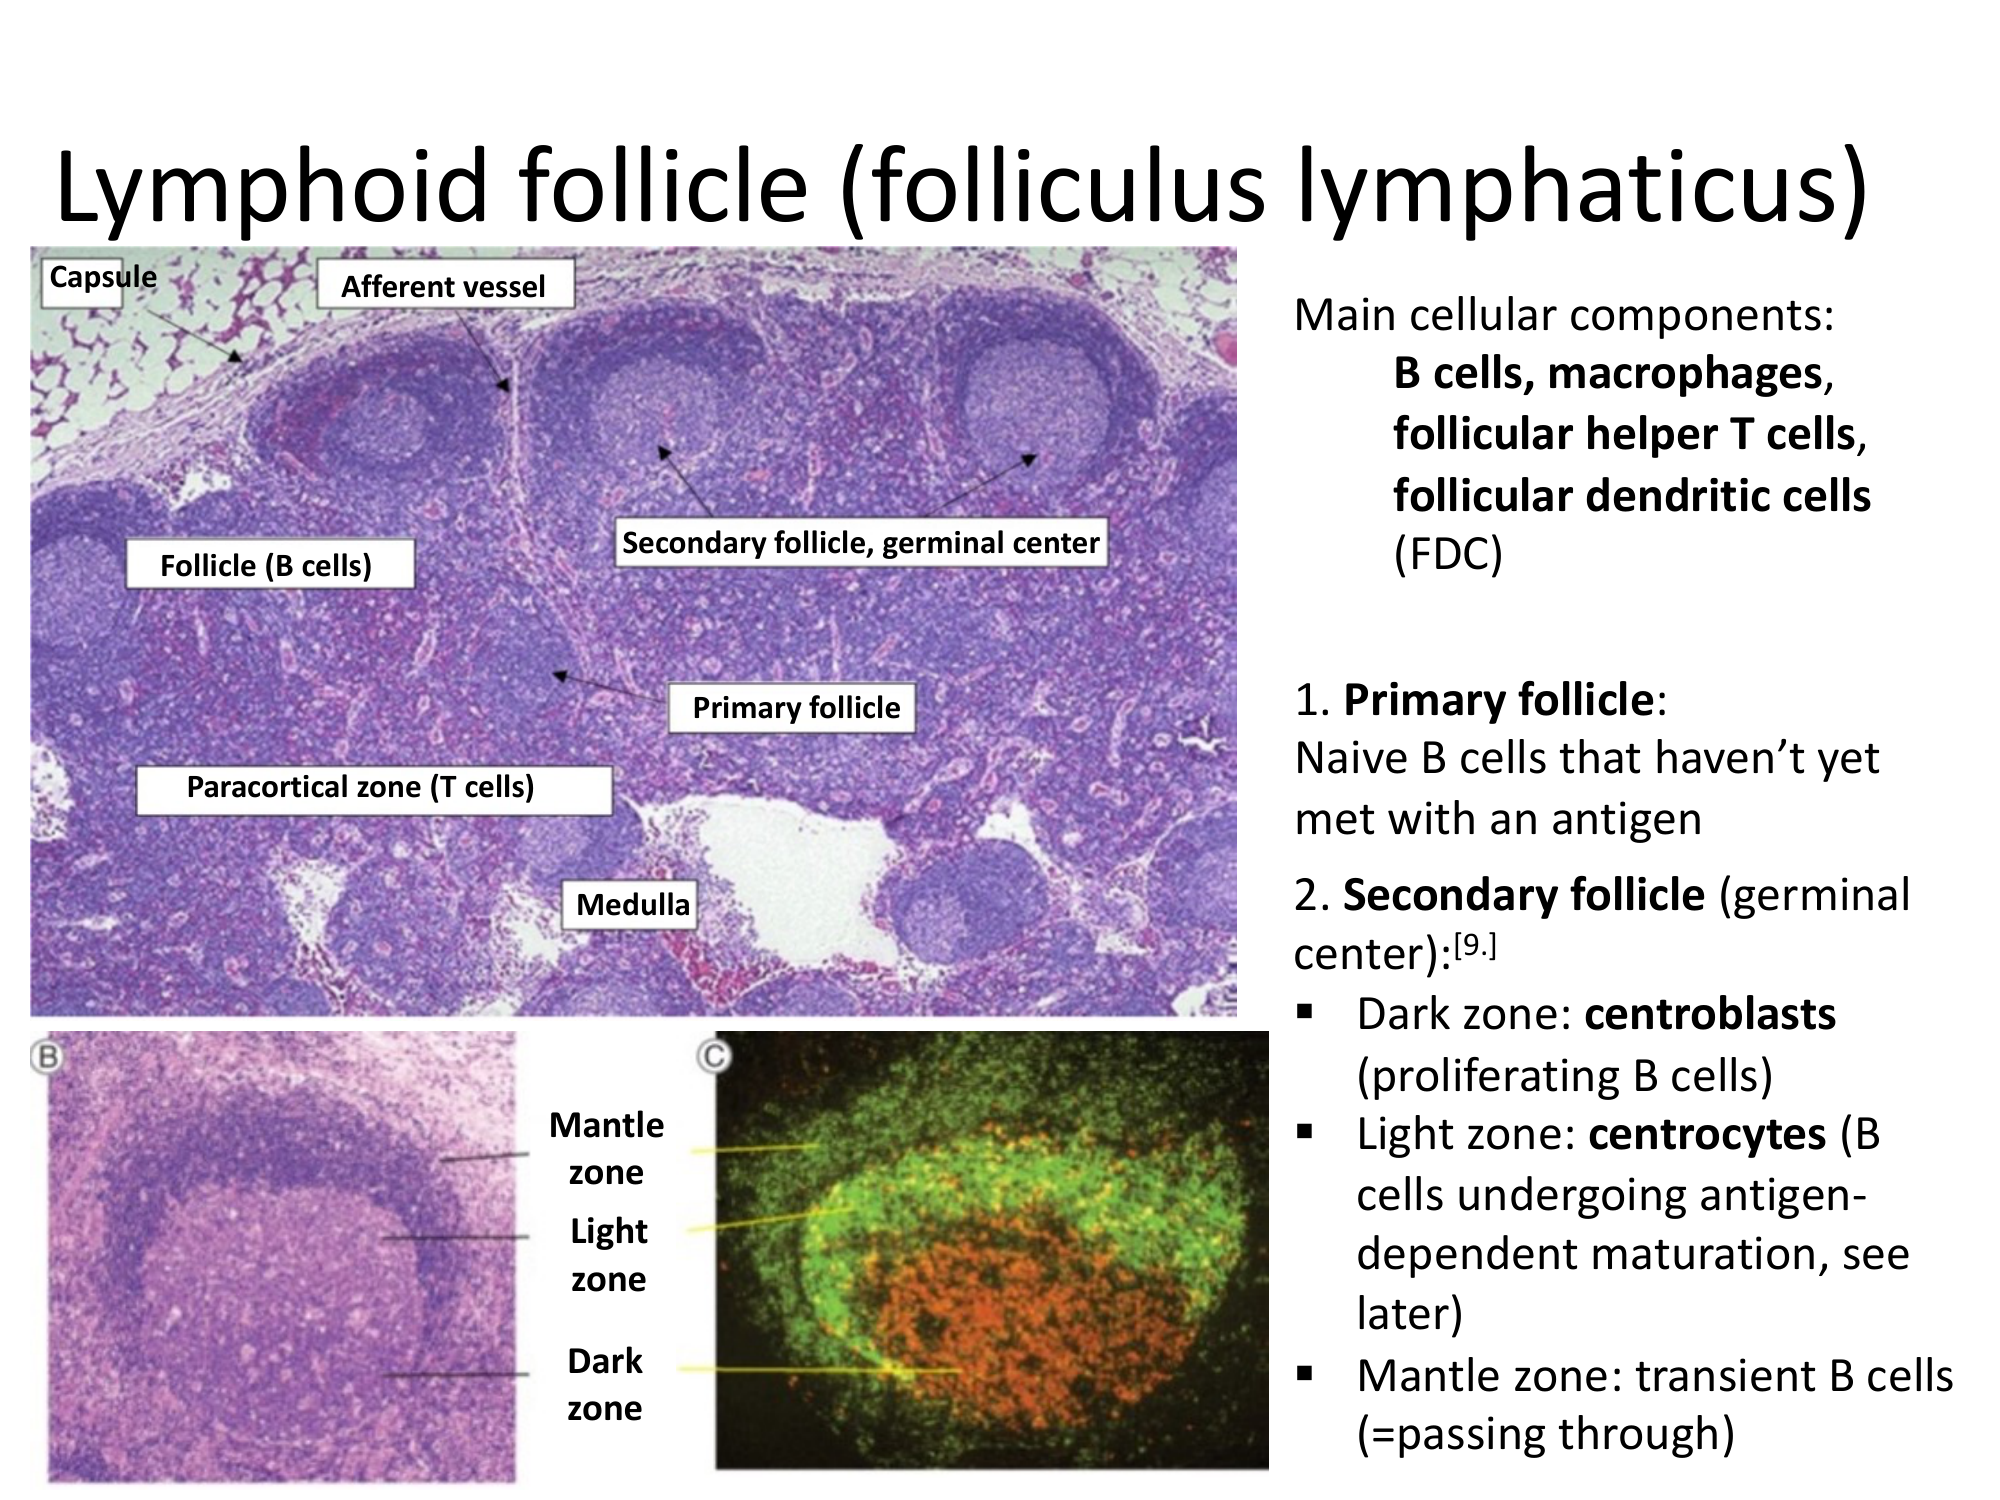
Lymphoid Follicle — Histology & Germinal Center

Histology images showing germinal center zones. The redesign presents a clean AI-generated follicle cross-section with labeled dark zone, light zone, and mantle zone alongside annotated microscopy.

Before
Before: Original slide 24 — germinal center histology
Histology images of germinal center, minimal zone labeling
After
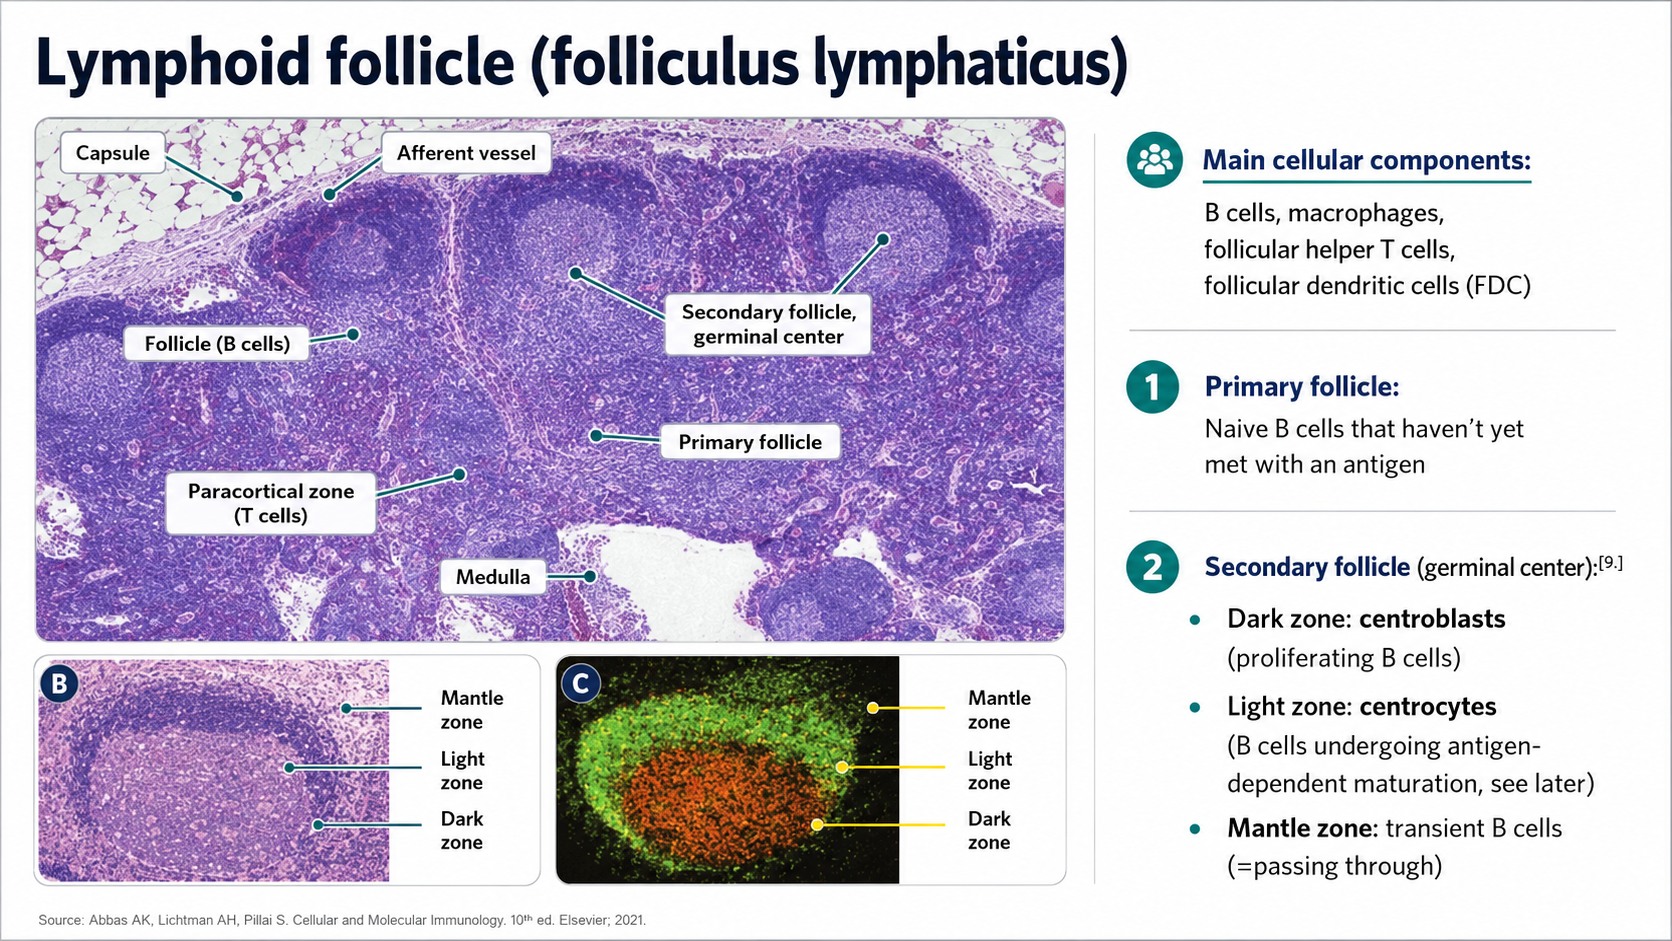
After: Redesigned slide 24 with AI-generated follicle cross-section
AI-generated follicle cross-section with labeled zones and annotated microscopy
25

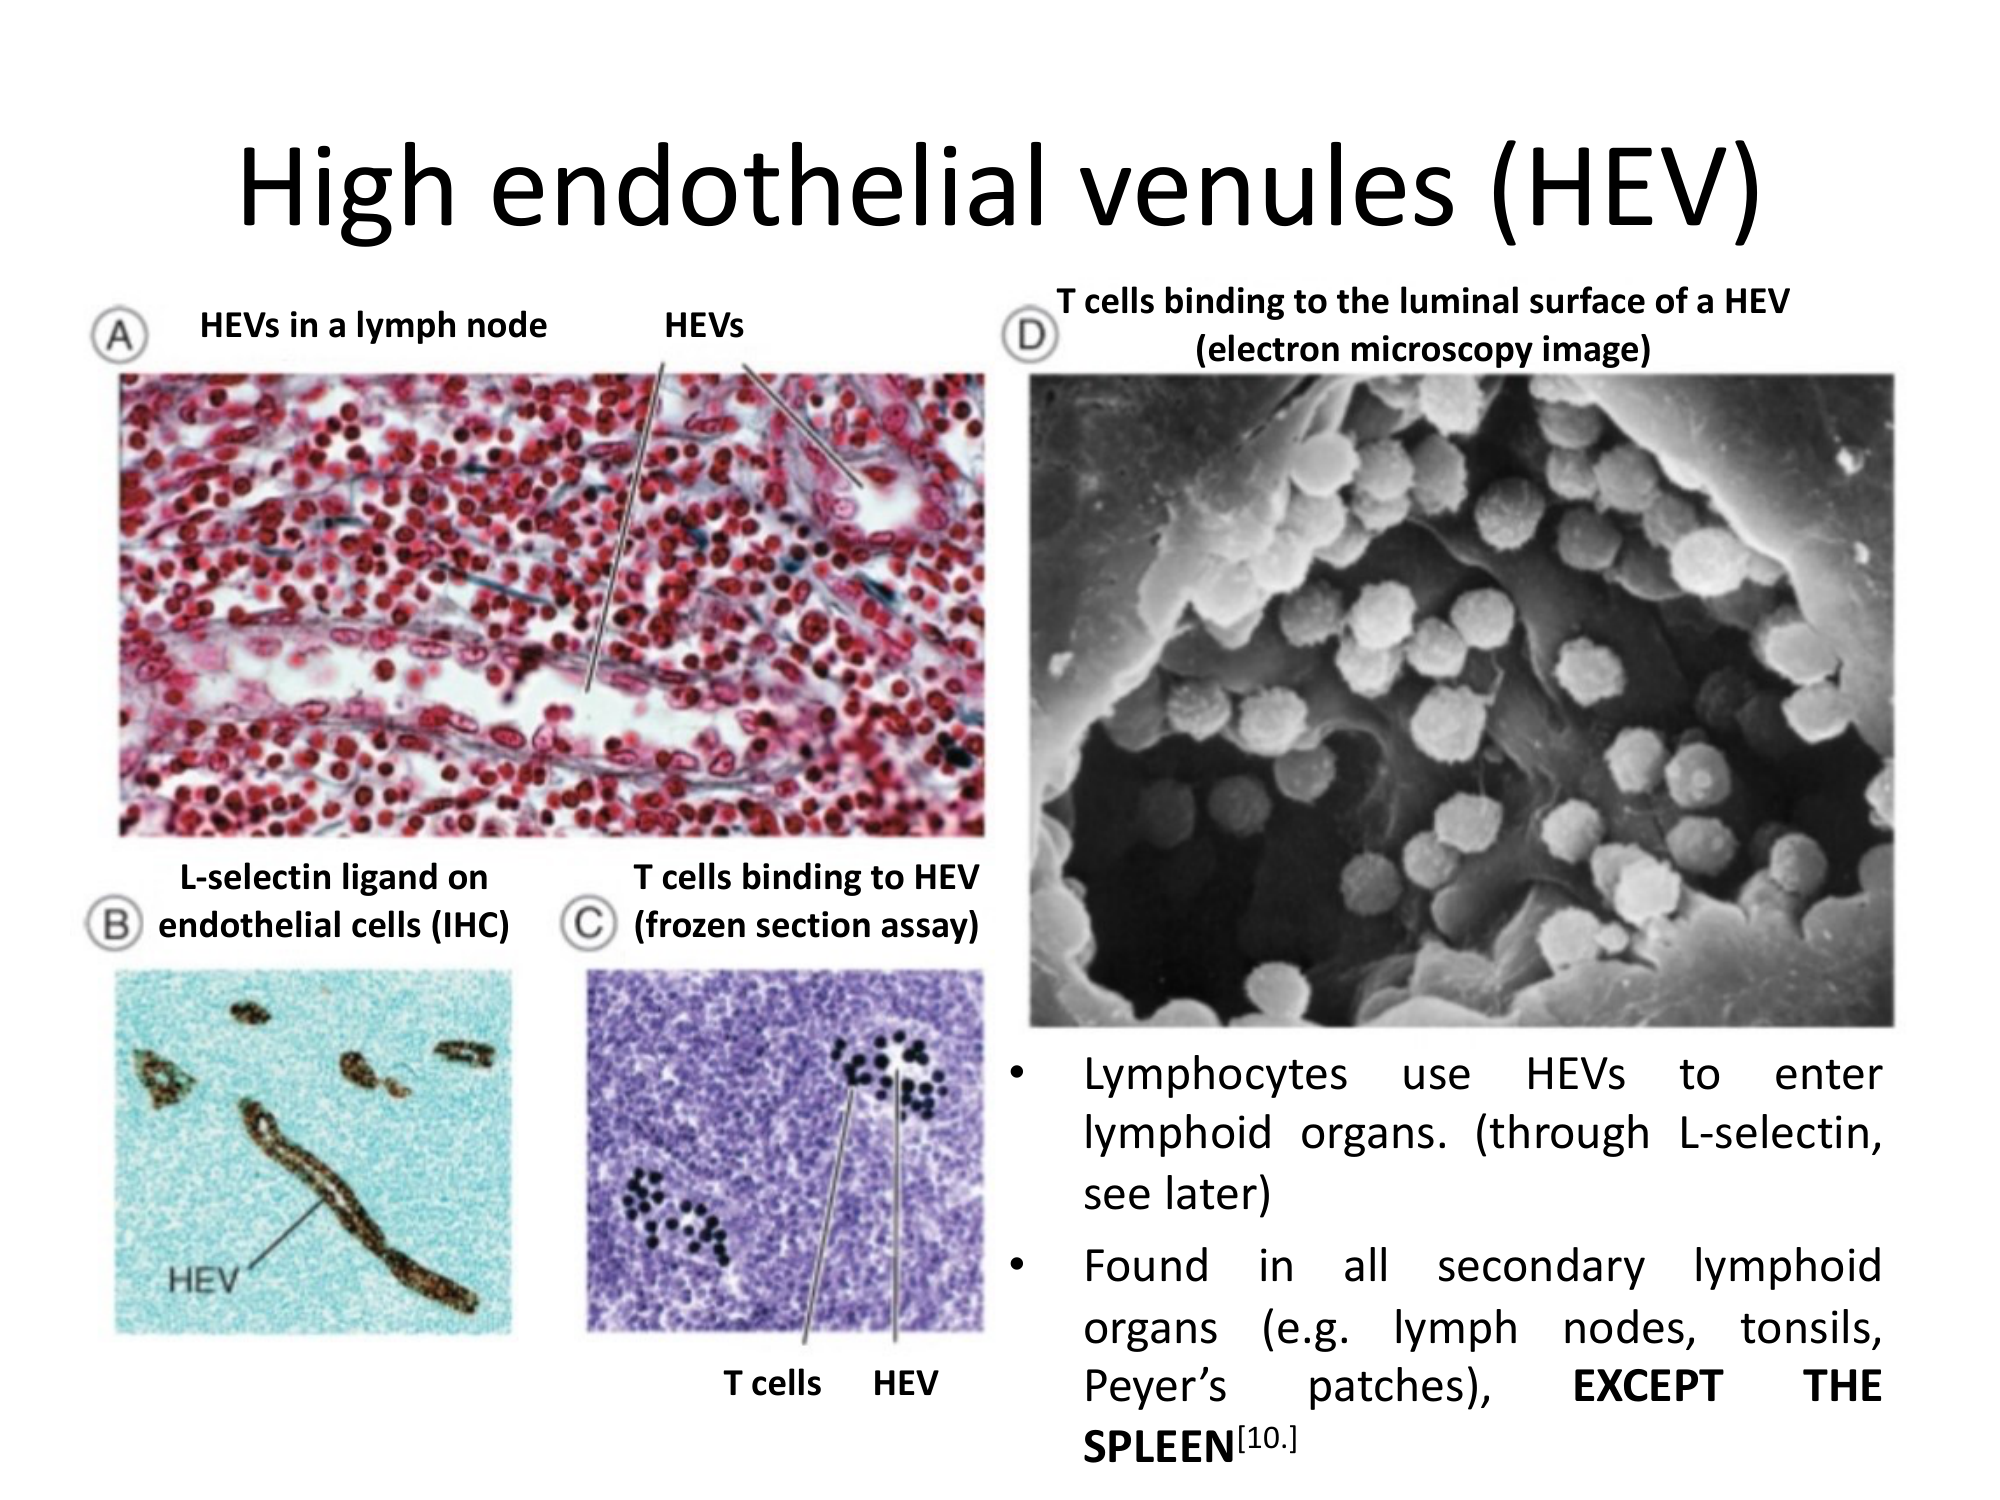
High Endothelial Venules (HEV) — Microscopy

Multiple microscopy images (H&E, IHC, electron microscopy) of HEVs. The redesign organizes the microscopy panel with consistent framing, clear technique labels, and AI-generated structural diagrams.

Before
Before: Original slide 25 — multiple HEV microscopy images
Multiple microscopy images with inconsistent sizing and labeling
After
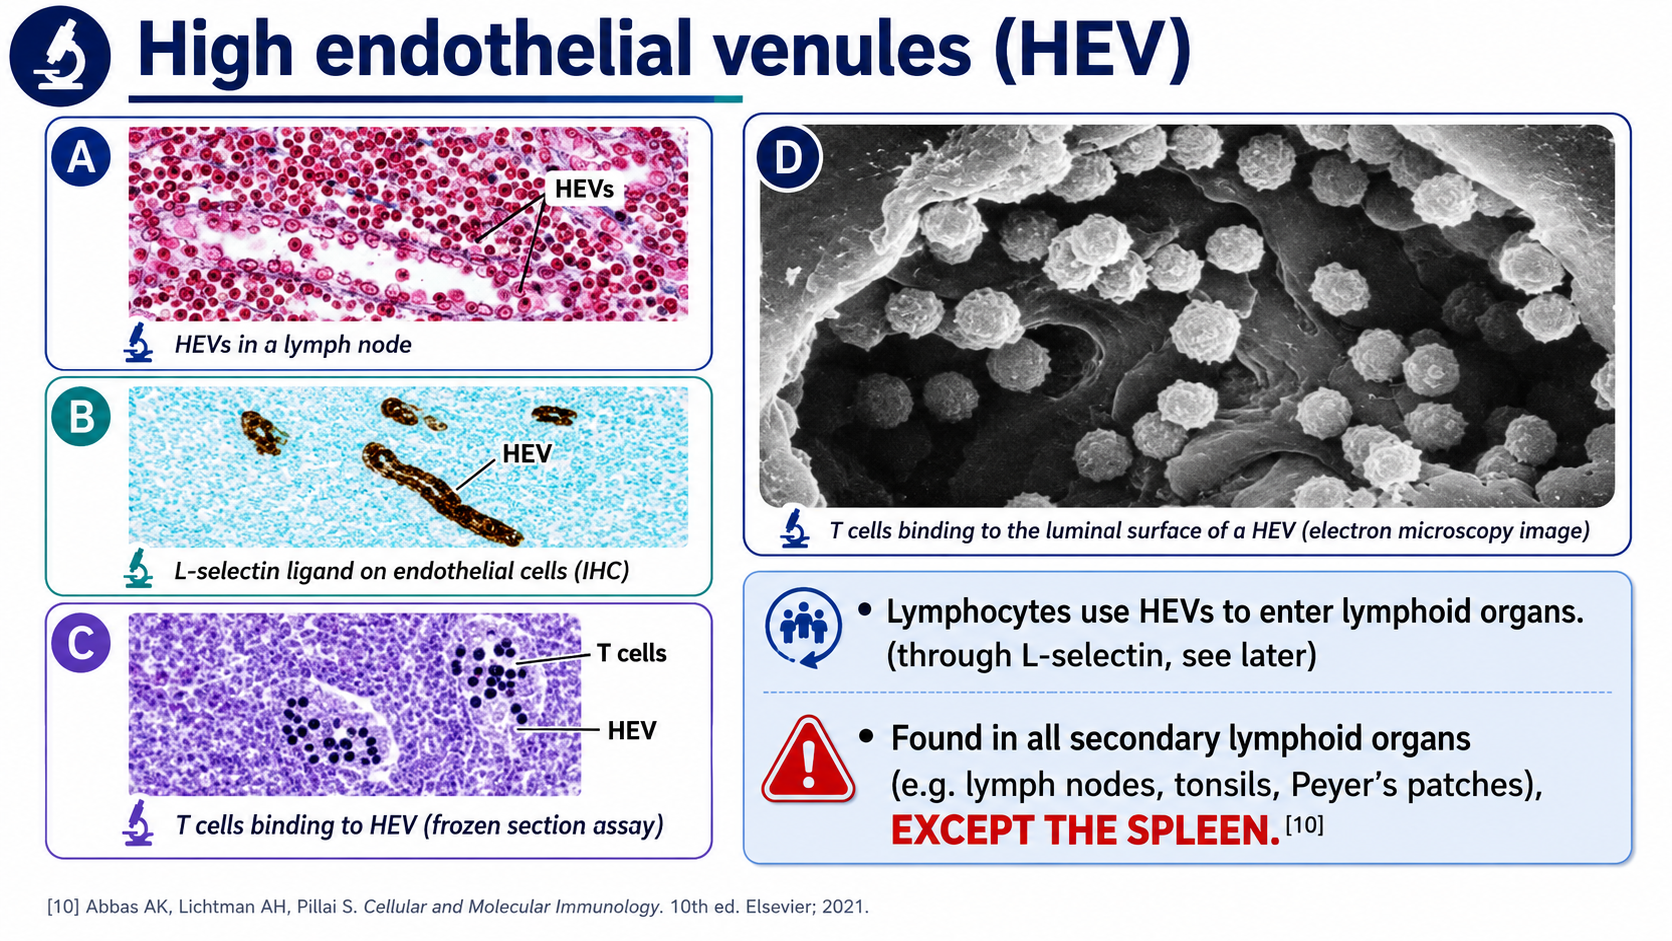
After: Redesigned slide 25 with organized HEV microscopy panel
Organized microscopy panel with consistent framing and technique labels
26

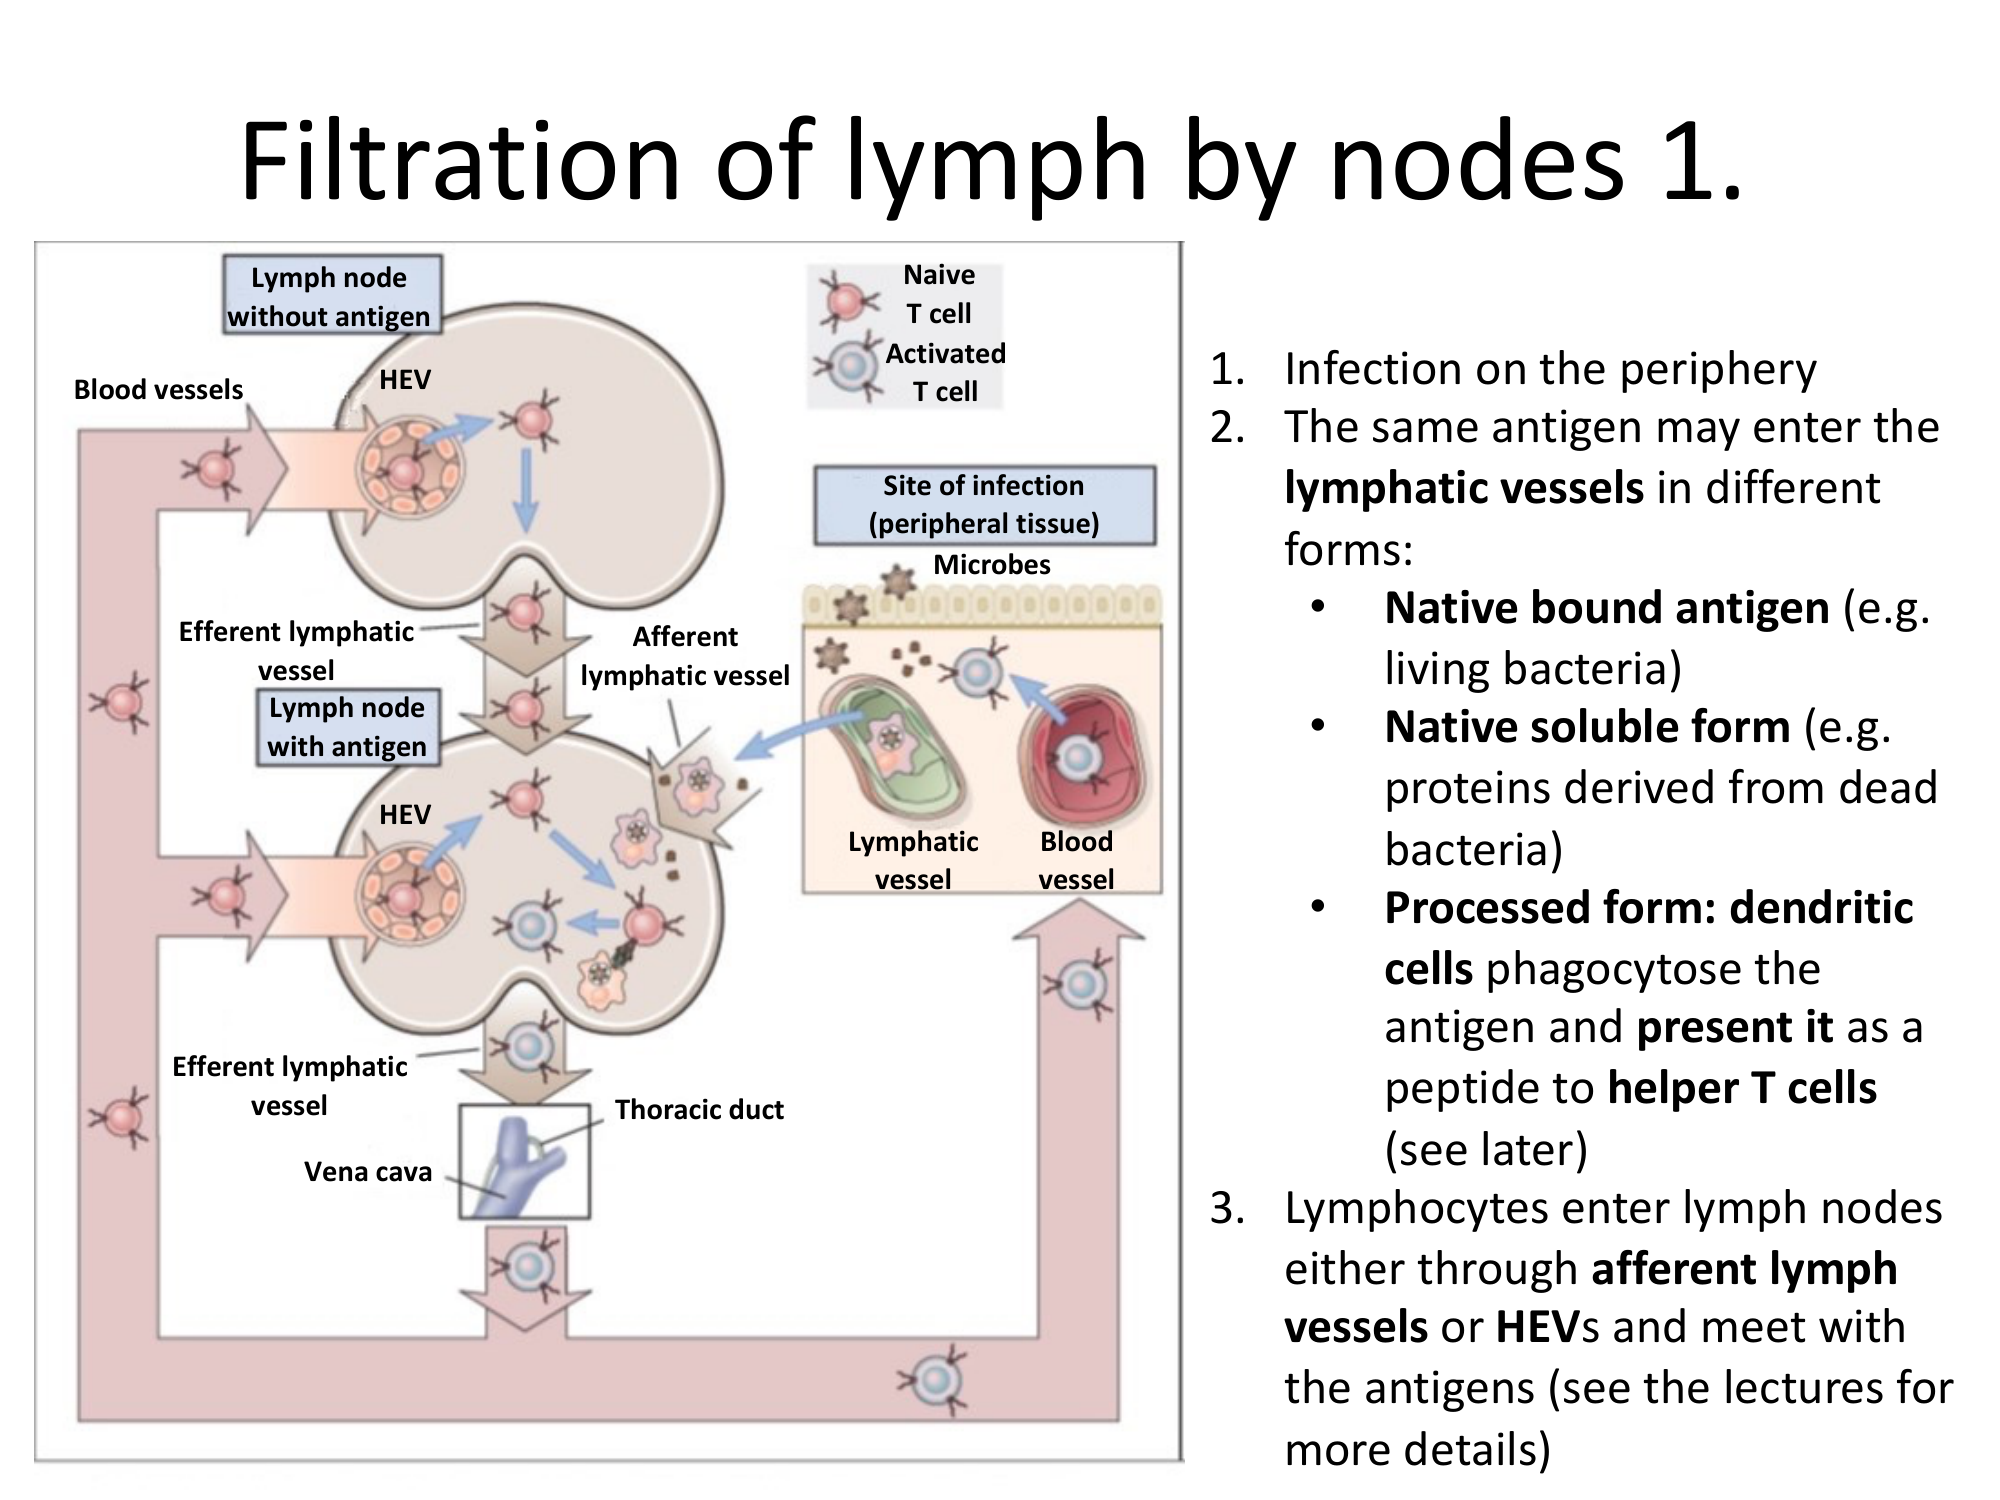
Filtration of Lymph 1 — Infection Flow Process

A process diagram showing how lymph nodes filter during infection. The redesign generates an intuitive AI-illustrated flowchart with pathogen entry, node filtration, and immune response steps clearly visualized.

Before
Before: Original slide 26 — lymph filtration process diagram
Basic process diagram of lymph filtration, generic arrows and boxes
After
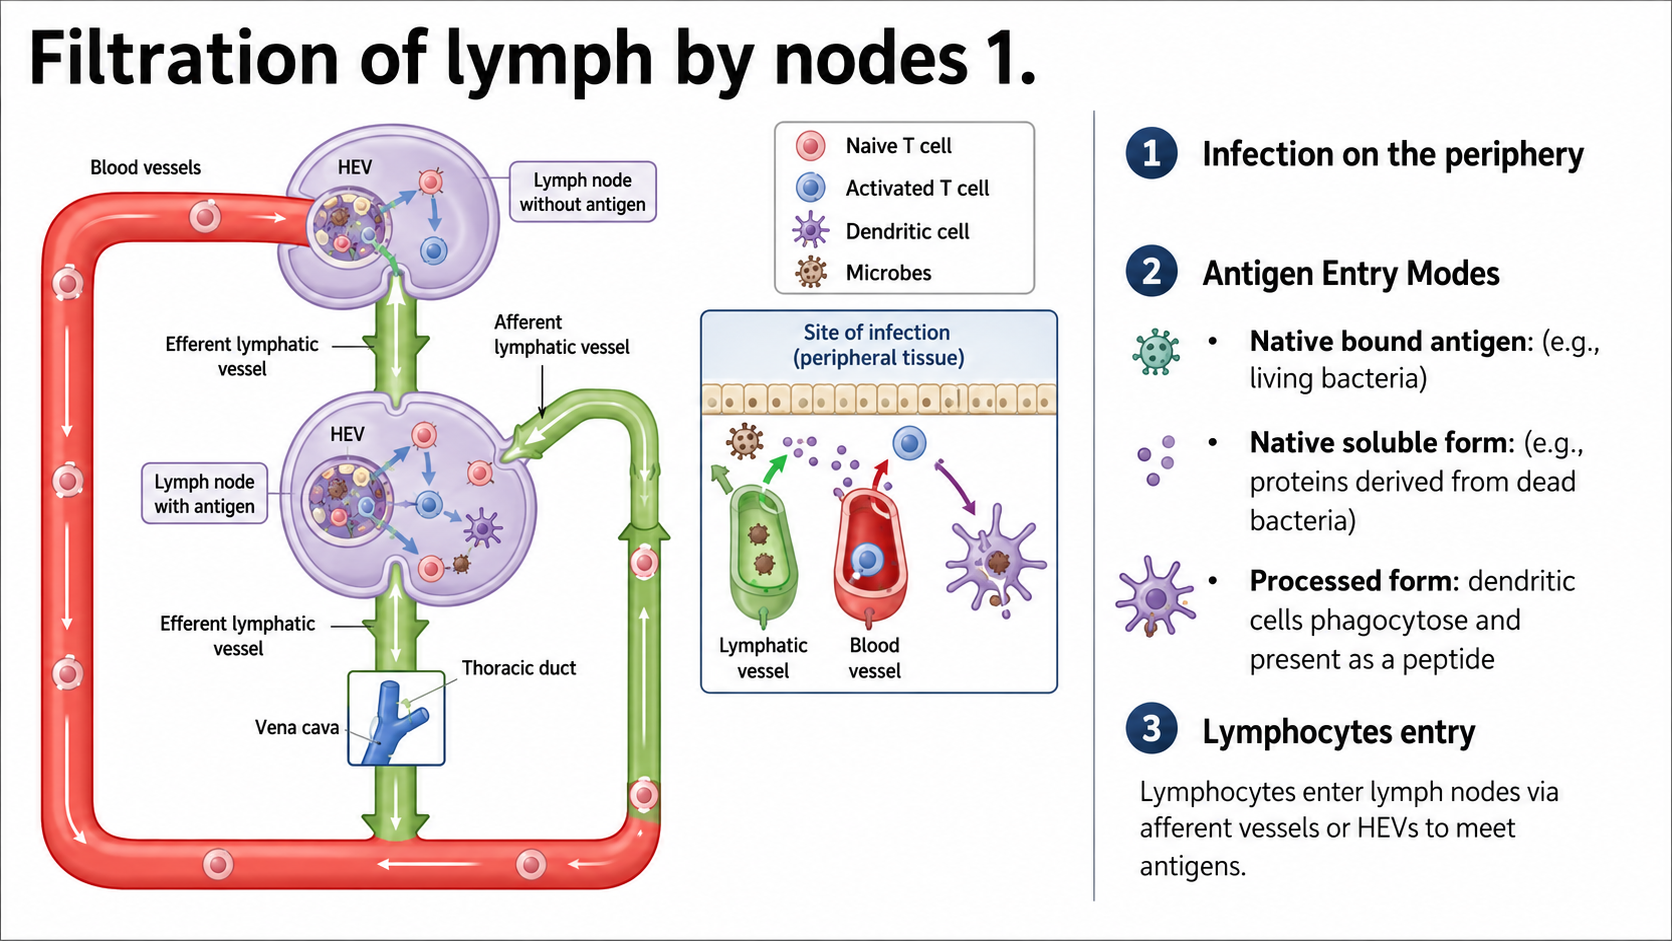
After: Redesigned slide 26 with AI-illustrated filtration flowchart
AI-illustrated flowchart with pathogen entry, node filtration, and immune response
27

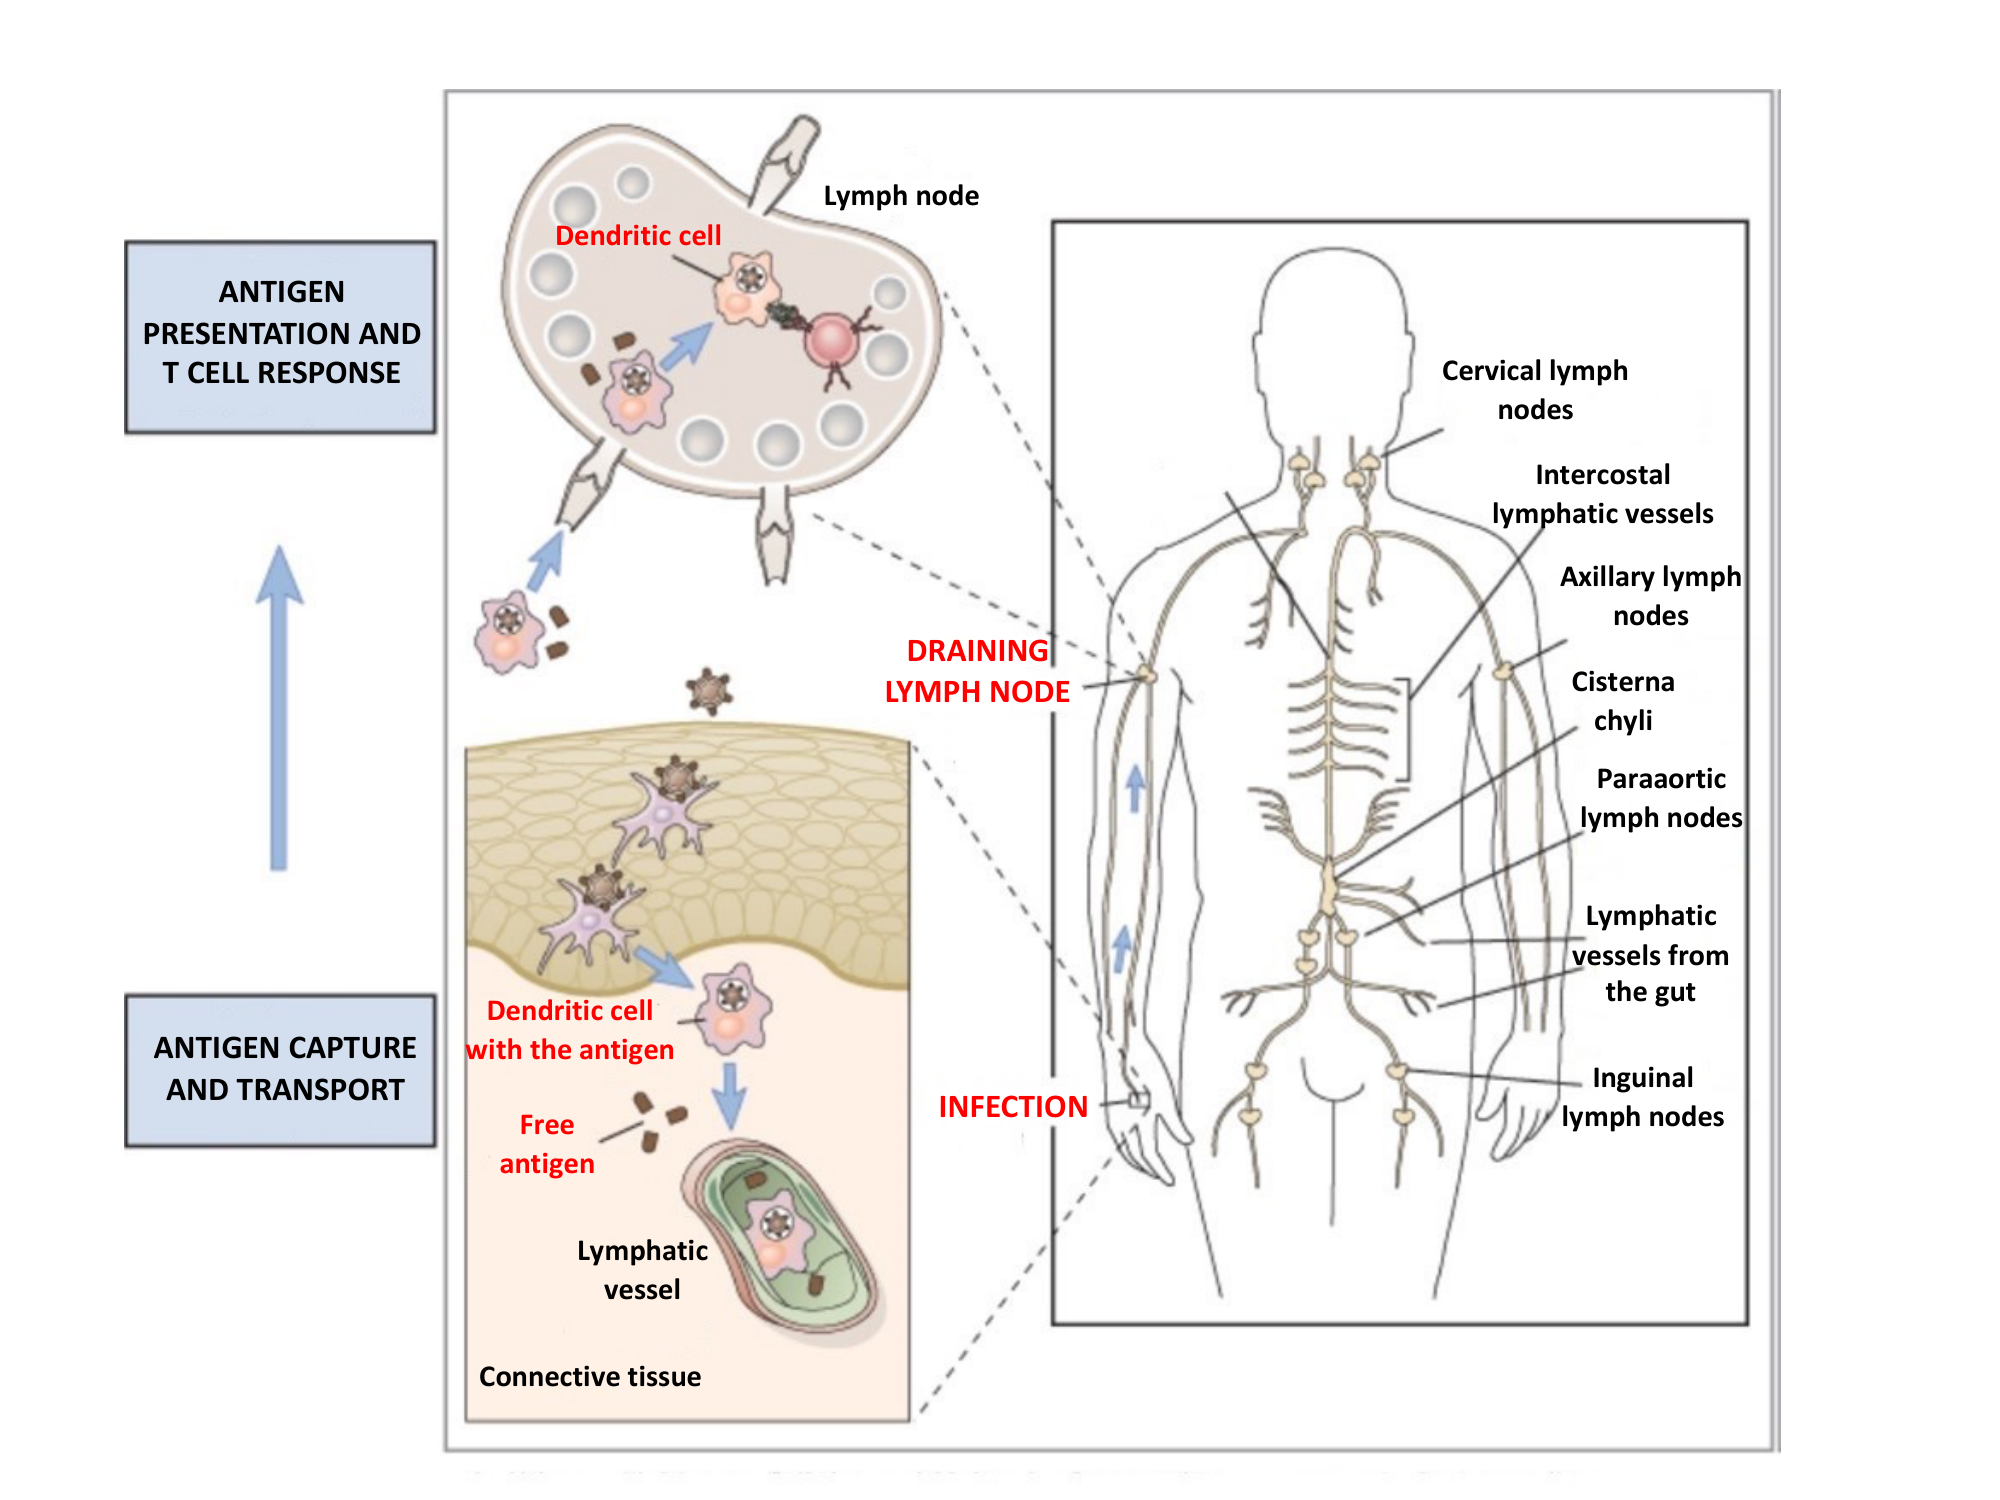
Filtration of Lymph 2 — Antigen Capture & Transport

Diagram showing antigen capture and transport within lymph nodes. The redesign creates a step-by-step AI-generated diagram showing dendritic cell capture, antigen presentation, and T-cell activation.

Before
Before: Original slide 27 — antigen capture and transport diagram
Complex antigen transport diagram, dense labeling
After
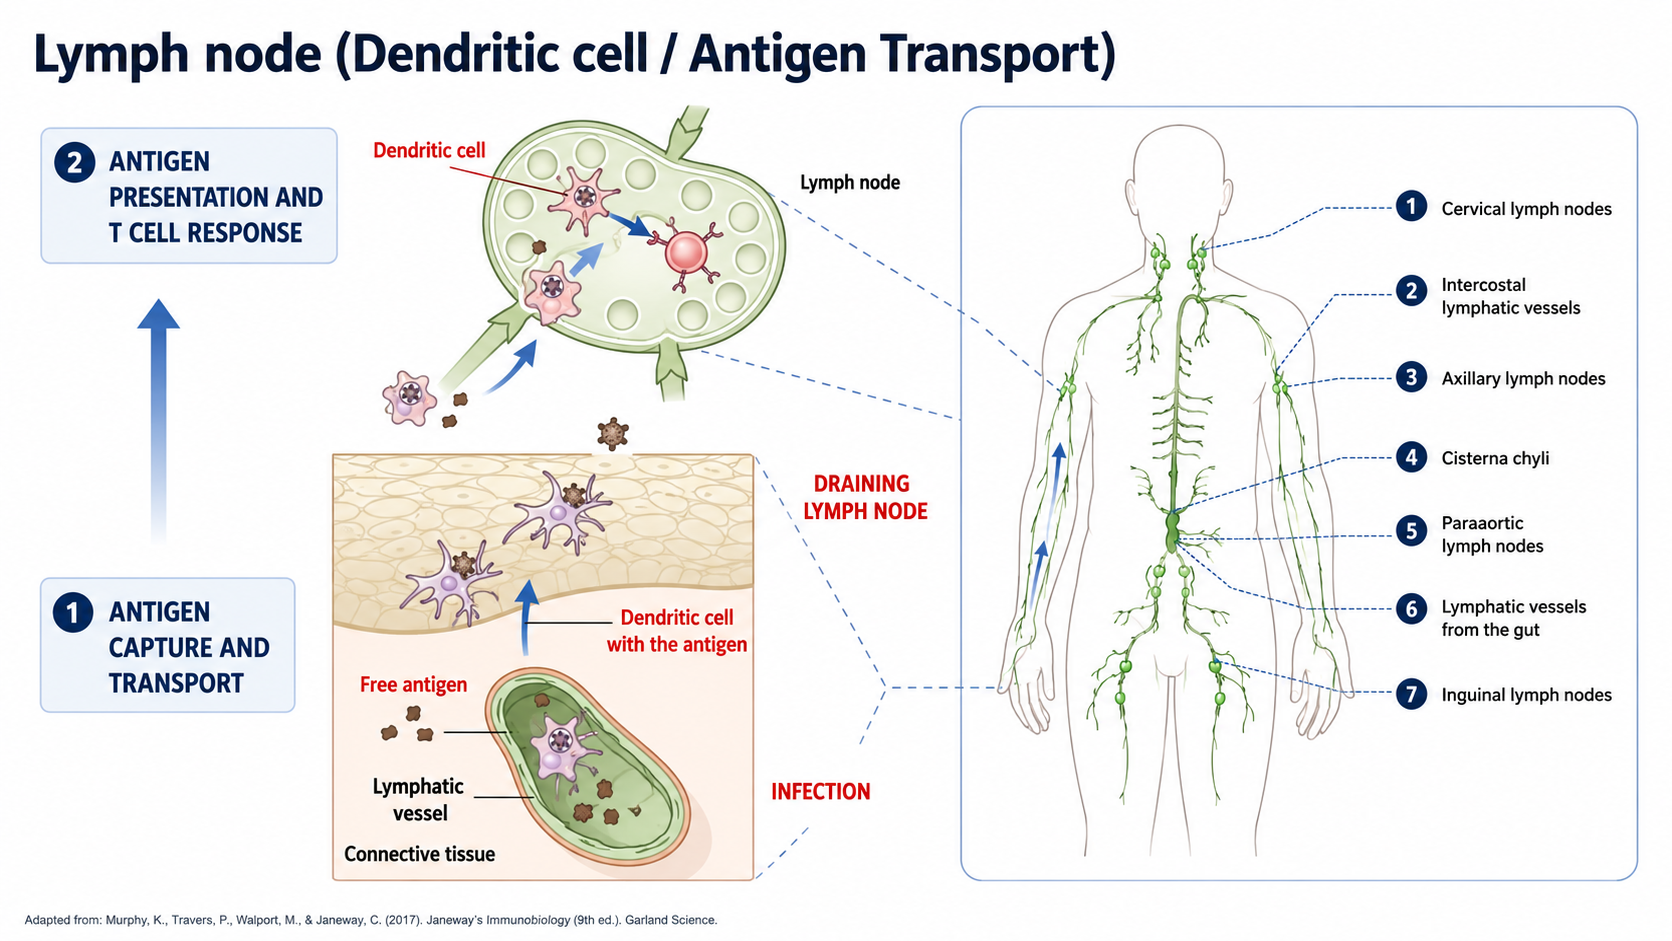
After: Redesigned slide 27 with step-by-step AI antigen capture diagram
Step-by-step AI-generated diagram of dendritic cell capture and T-cell activation
28

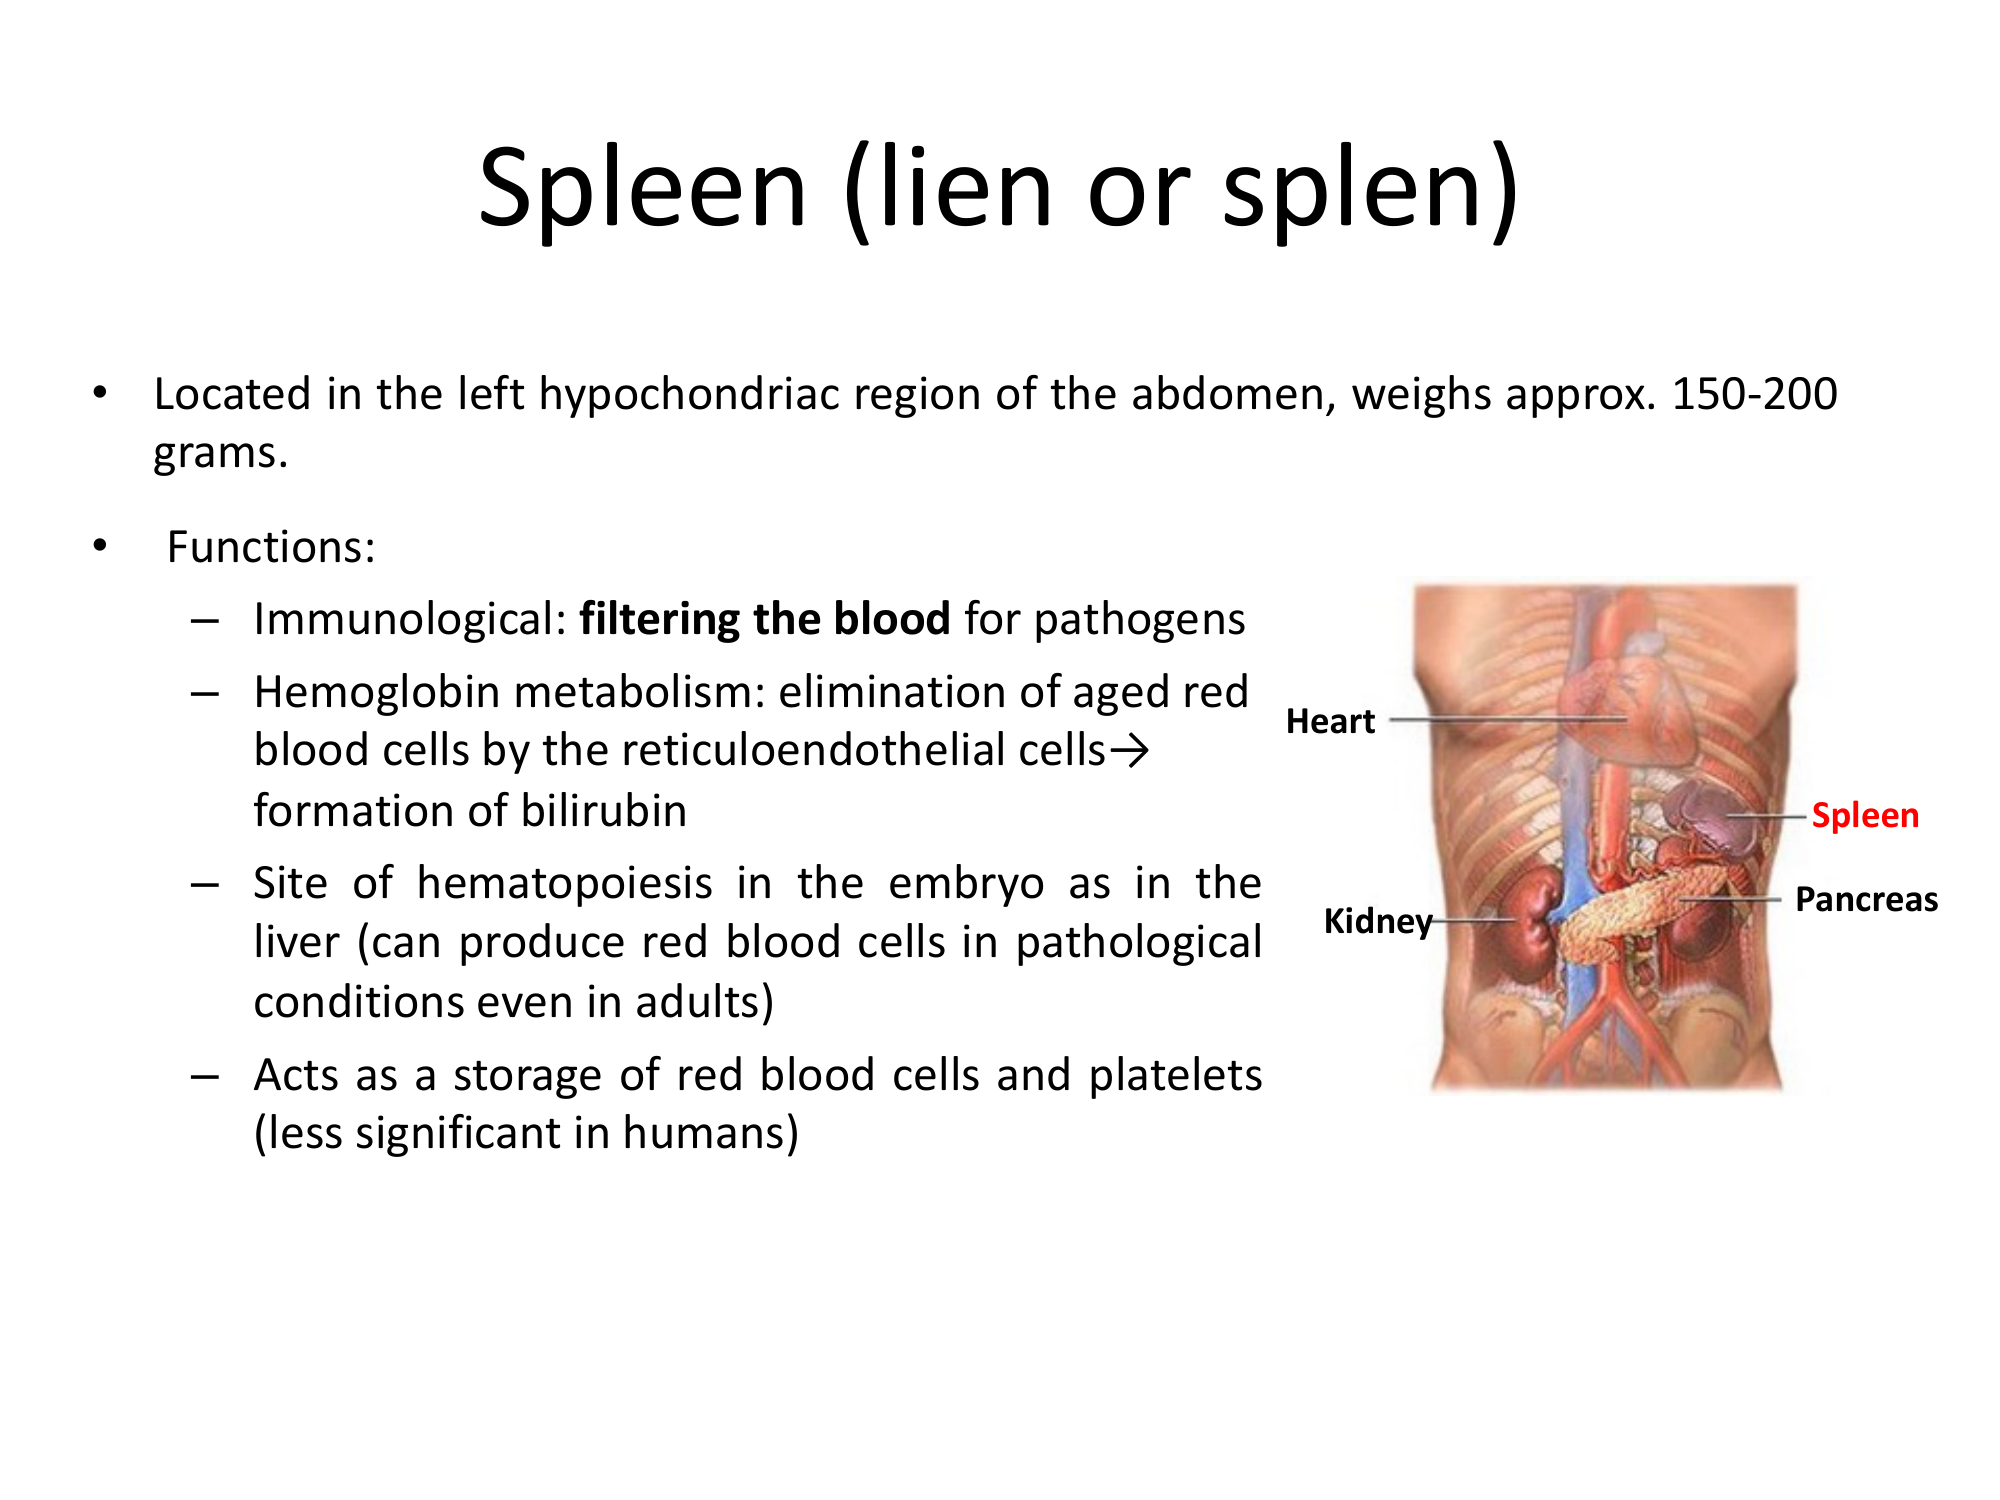
Spleen (Lien) — Functions & Anatomy

Function list with an anatomical position illustration of the spleen. The redesign generates a precise AI illustration of the spleen showing its anatomical position, vasculature, and key functional roles.

Before
Before: Original slide 28 — spleen function list and anatomy
Text function list with generic anatomical illustration
After
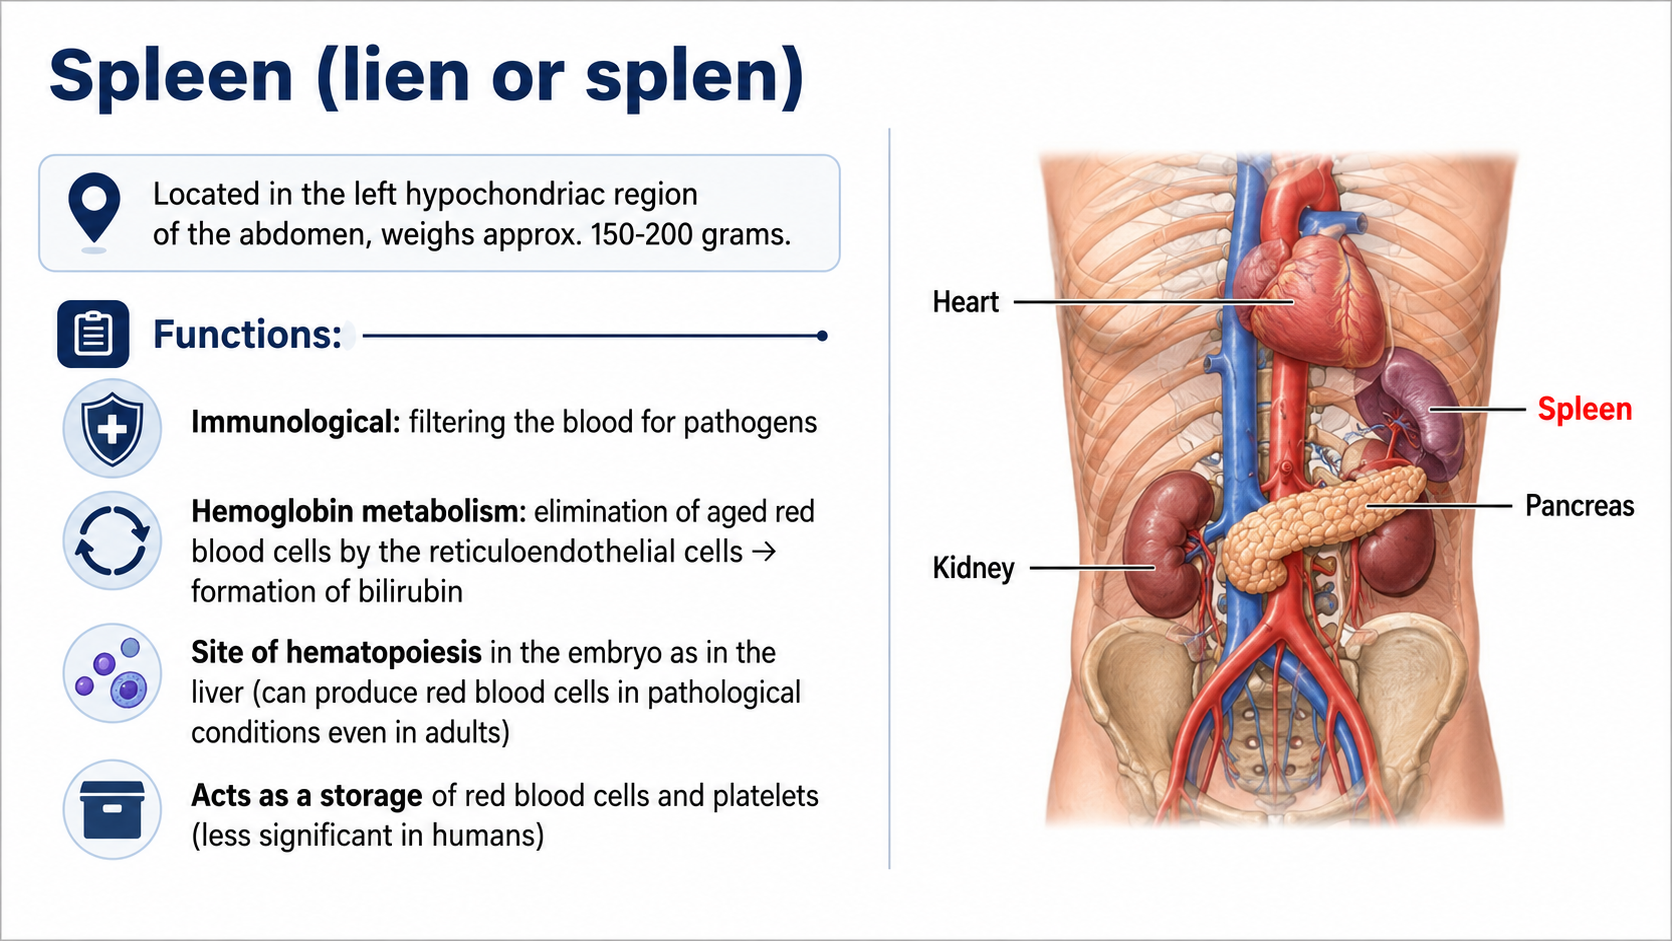
After: Redesigned slide 28 with AI-generated spleen anatomy illustration
AI-generated spleen illustration with anatomical position and vasculature
29

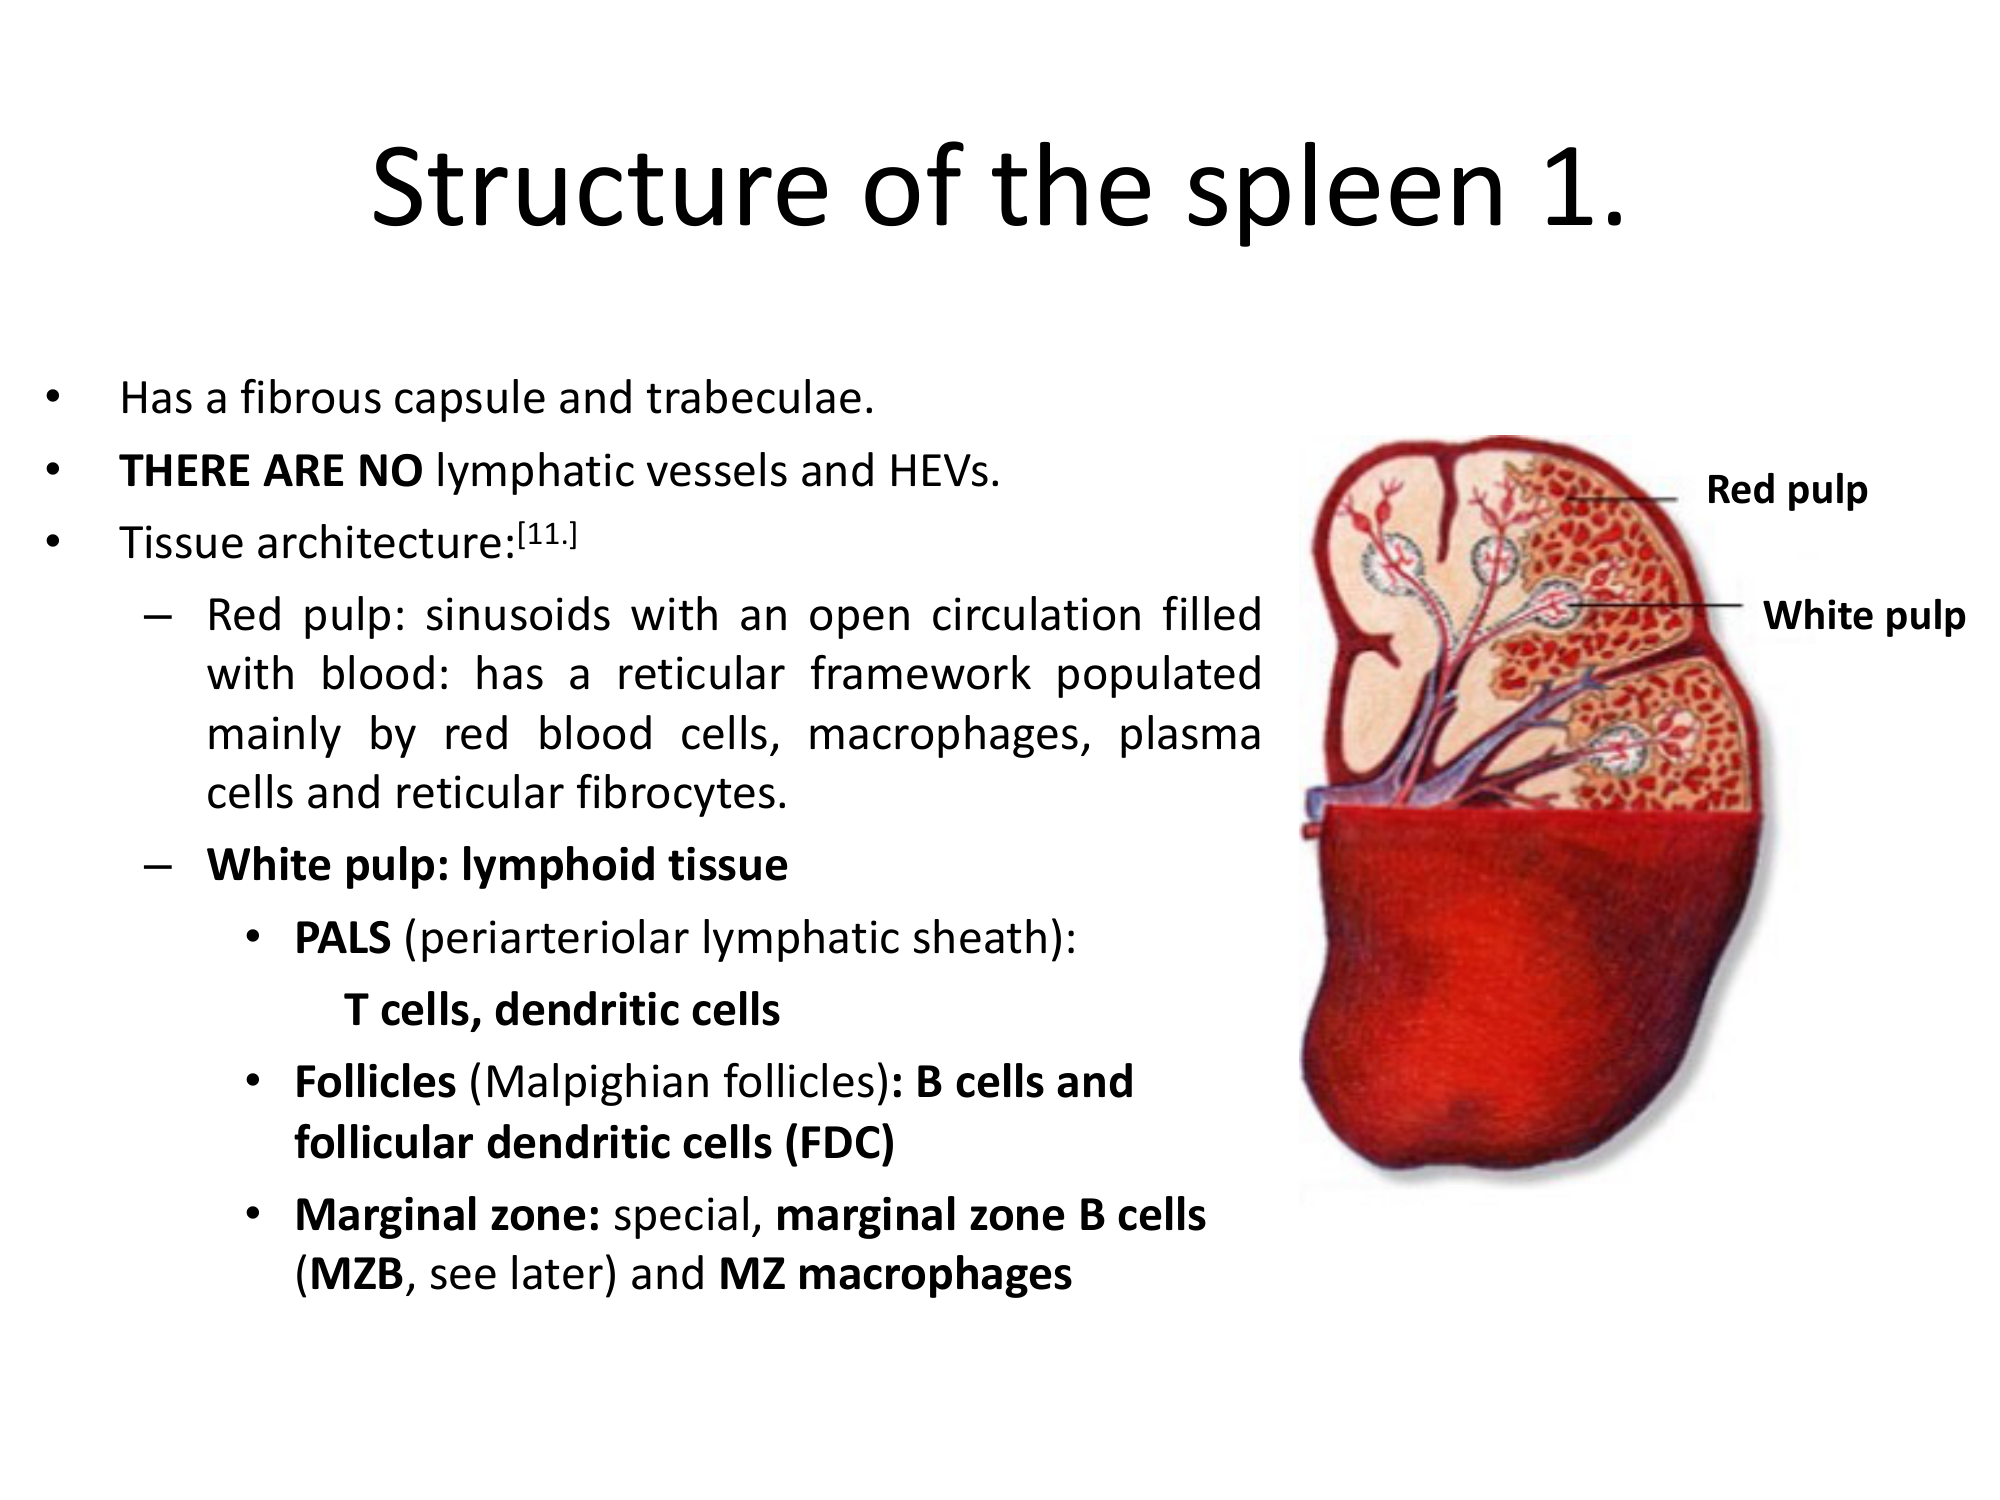
Structure of the Spleen 1 — White & Red Pulp

Tissue architecture diagram showing white and red pulp. The redesign creates a detailed AI-generated cross-section of splenic tissue with color-coded white pulp, red pulp, and marginal zone.

Before
Before: Original slide 29 — spleen tissue architecture diagram
Basic tissue architecture diagram, generic labeling
After
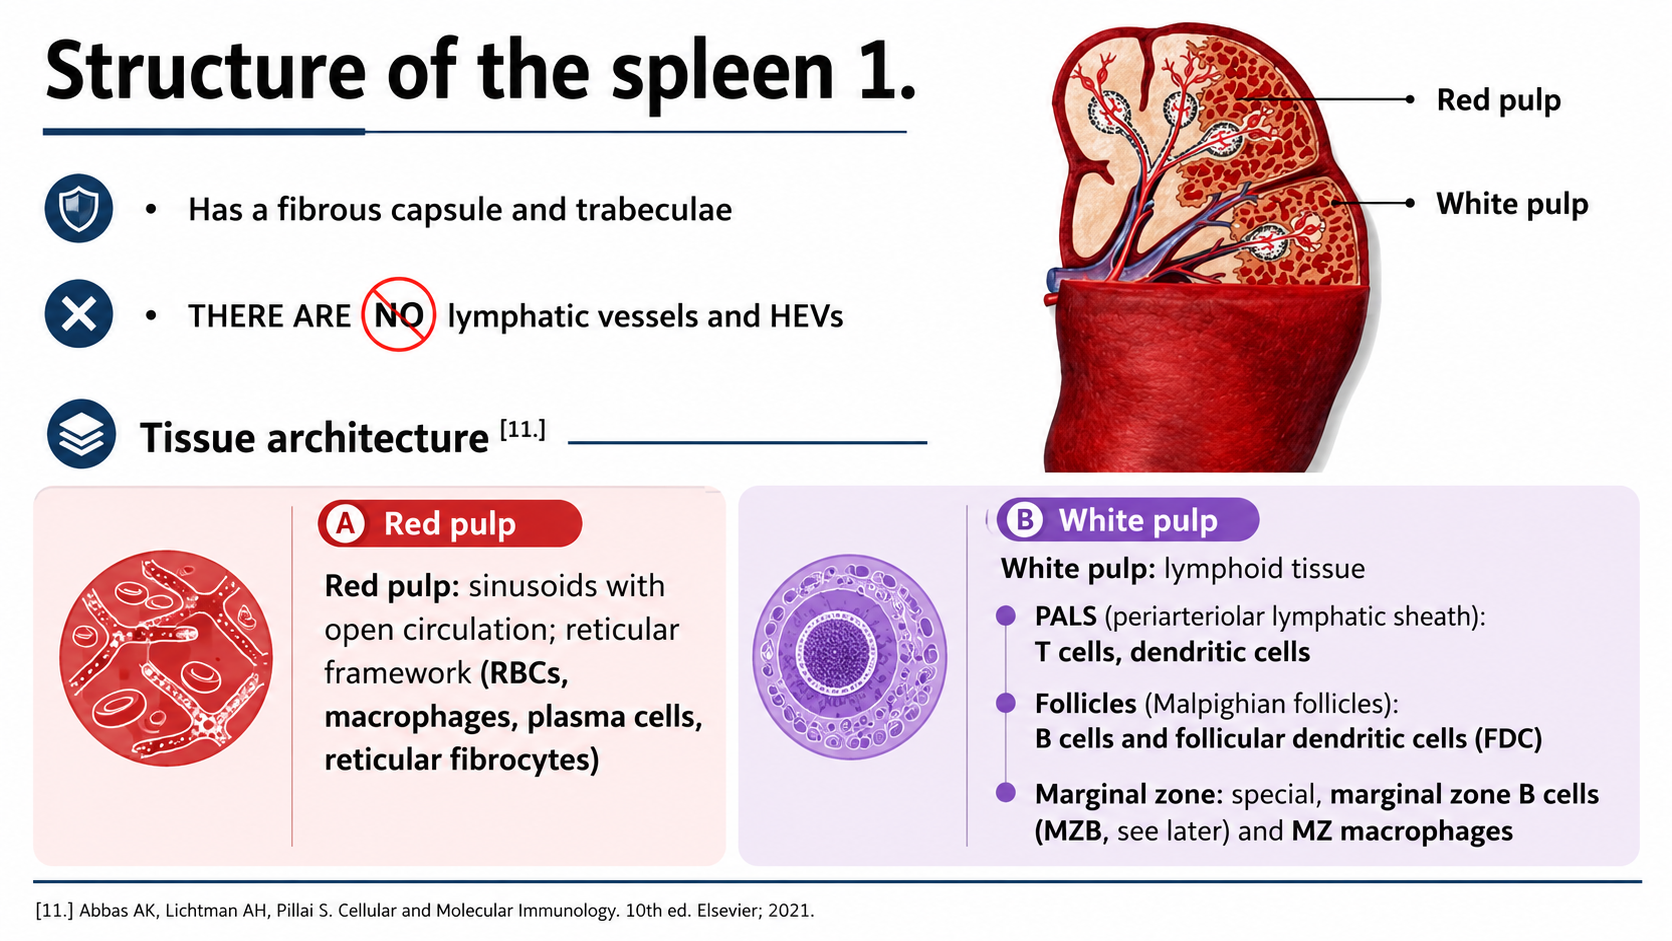
After: Redesigned slide 29 with AI-generated splenic tissue cross-section
AI-generated splenic cross-section with color-coded pulp regions and marginal zone
30

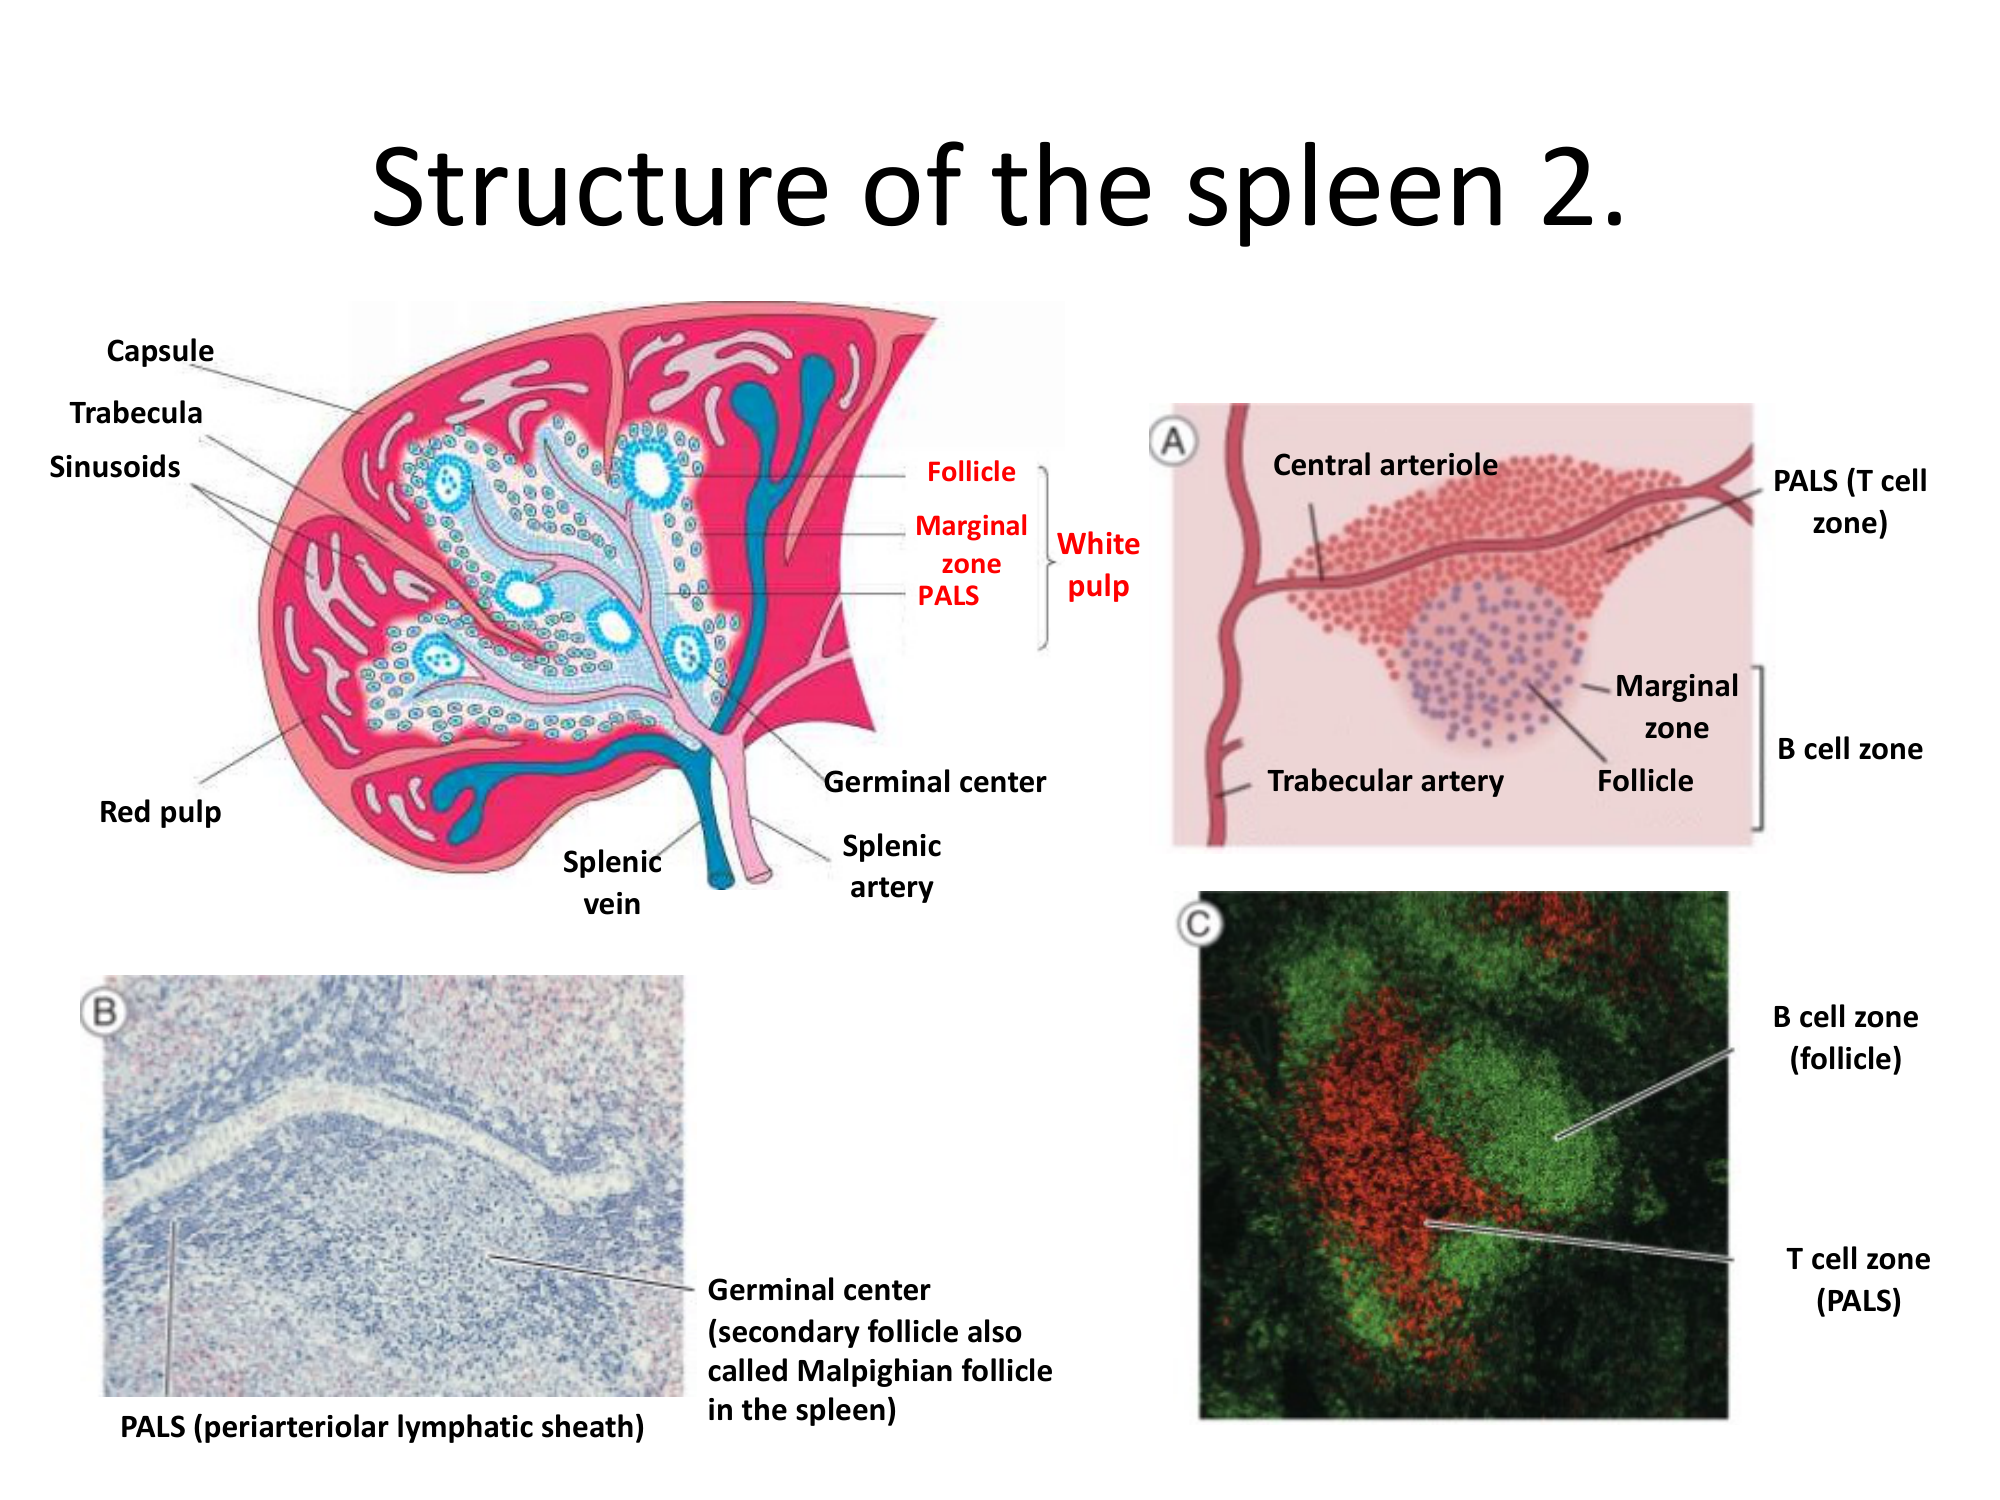
Structure of the Spleen 2 — Microscopy & Immunofluorescence

Detailed cross-section with microscopy and immunofluorescence images. The redesign integrates clinical microscopy with AI-generated structural diagrams in a clean, organized panel layout.

Before
Before: Original slide 30 — spleen microscopy and immunofluorescence
Cluttered microscopy and fluorescence images, inconsistent layout
After
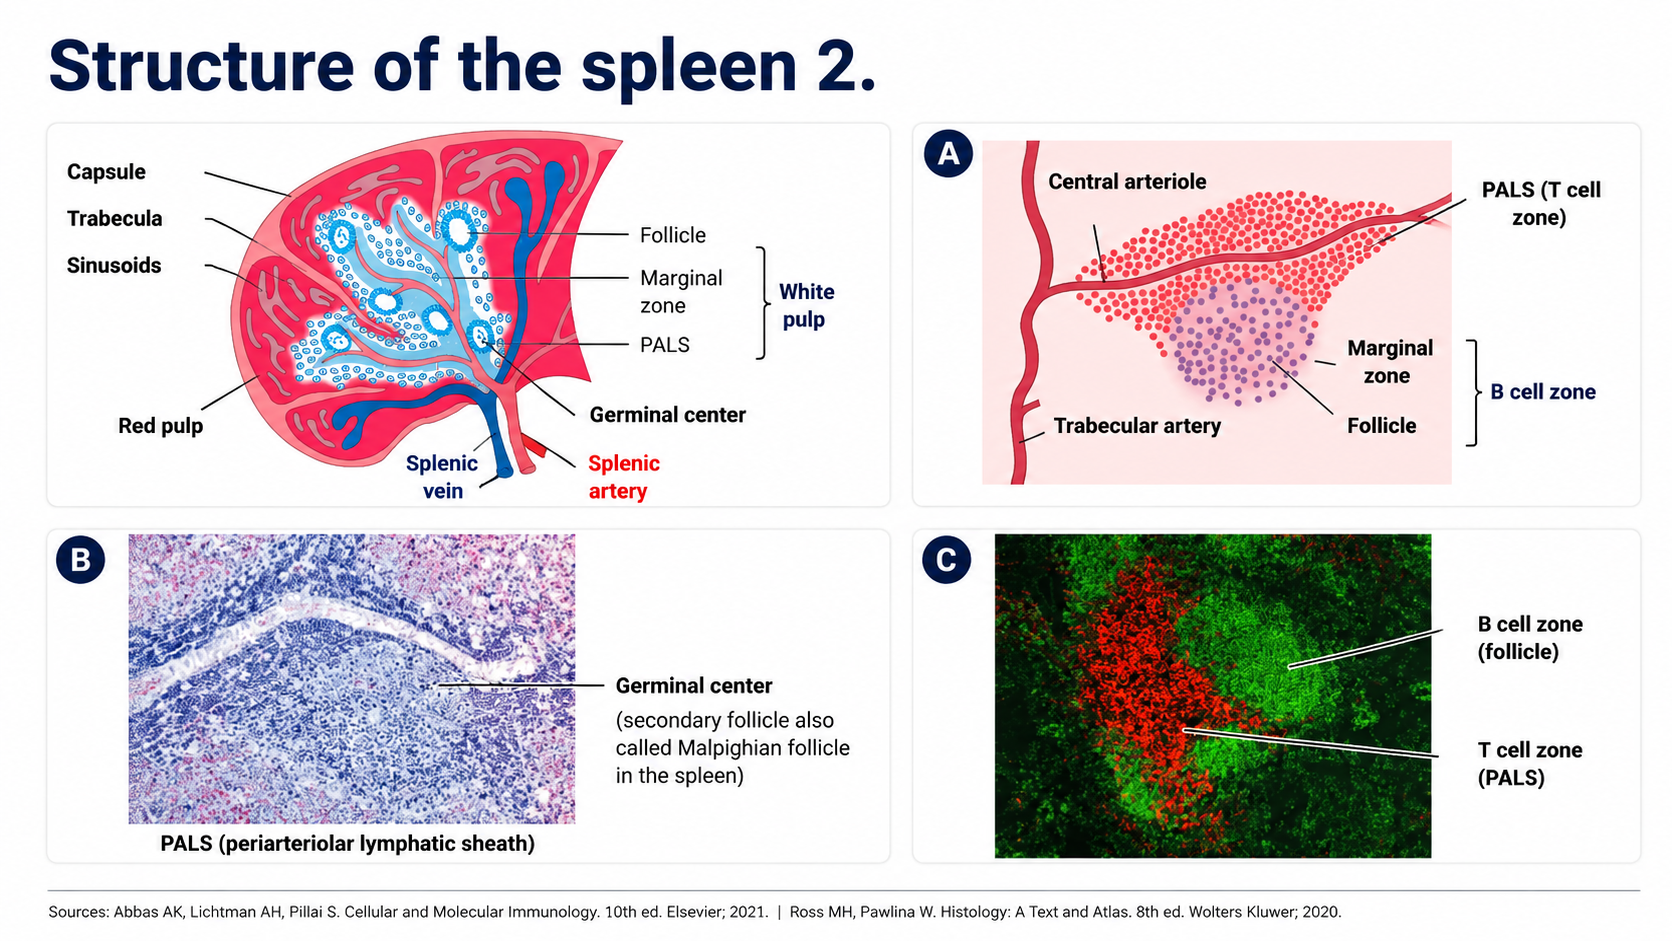
After: Redesigned slide 30 with organized spleen microscopy panel
Organized panel with AI structural diagrams and integrated microscopy
31

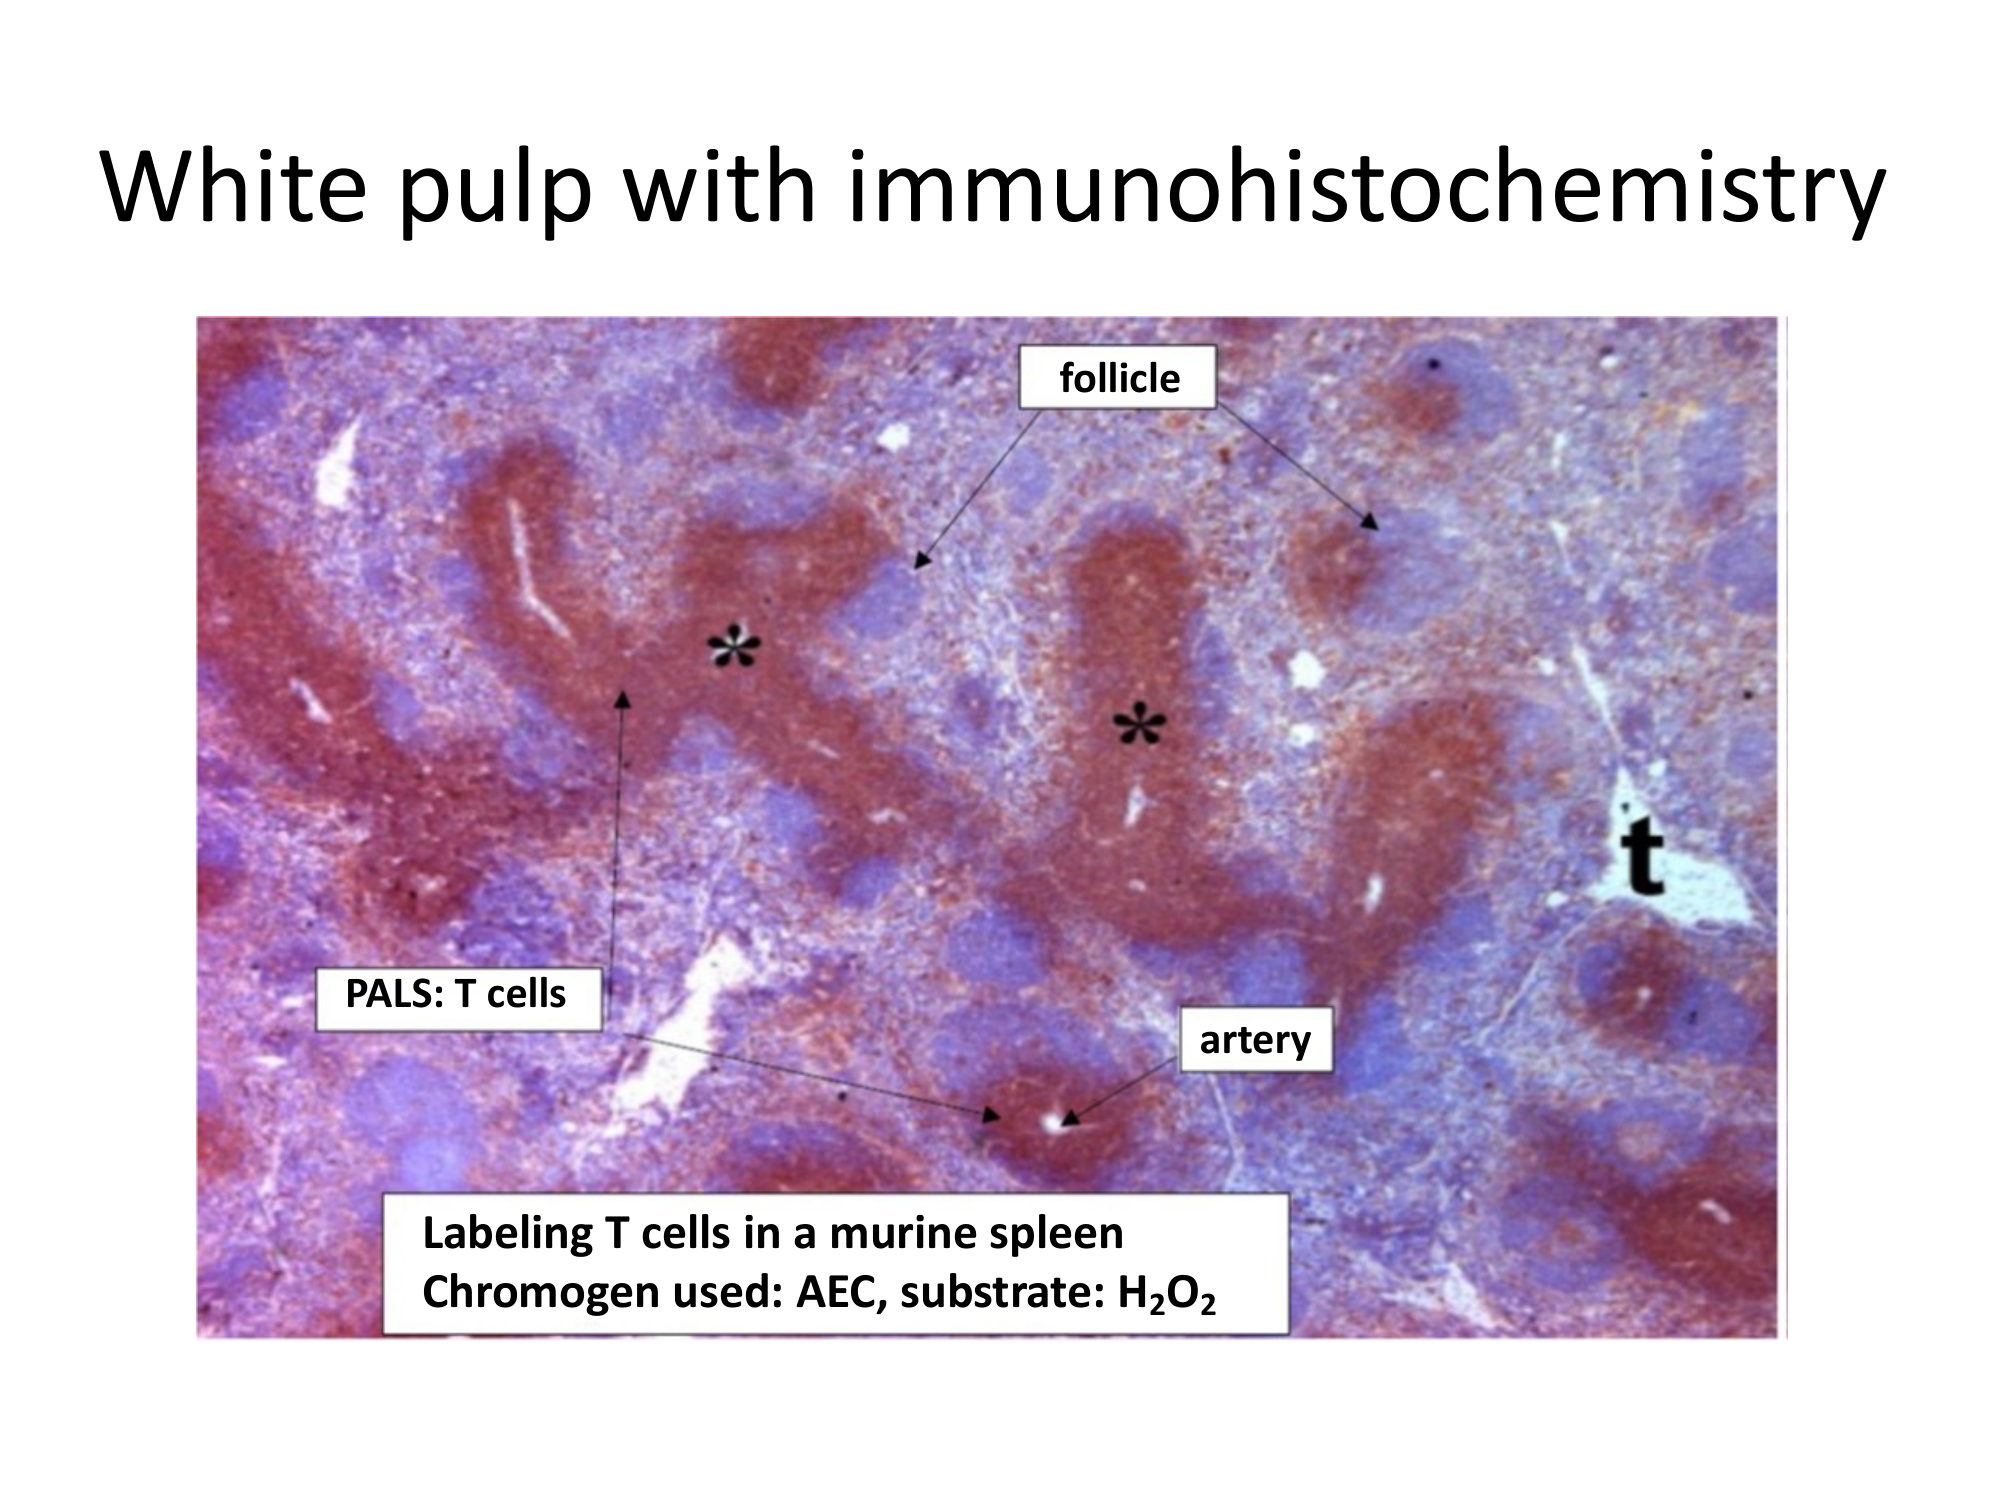
White Pulp — Immunohistochemistry

Labeled immunohistochemistry microscopy image of white pulp. The redesign presents the microscopy with clear AI-generated overlay annotations identifying PALS, follicles, and marginal zone.

Before
Before: Original slide 31 — white pulp immunohistochemistry
Labeled microscopy image, cluttered annotations
After
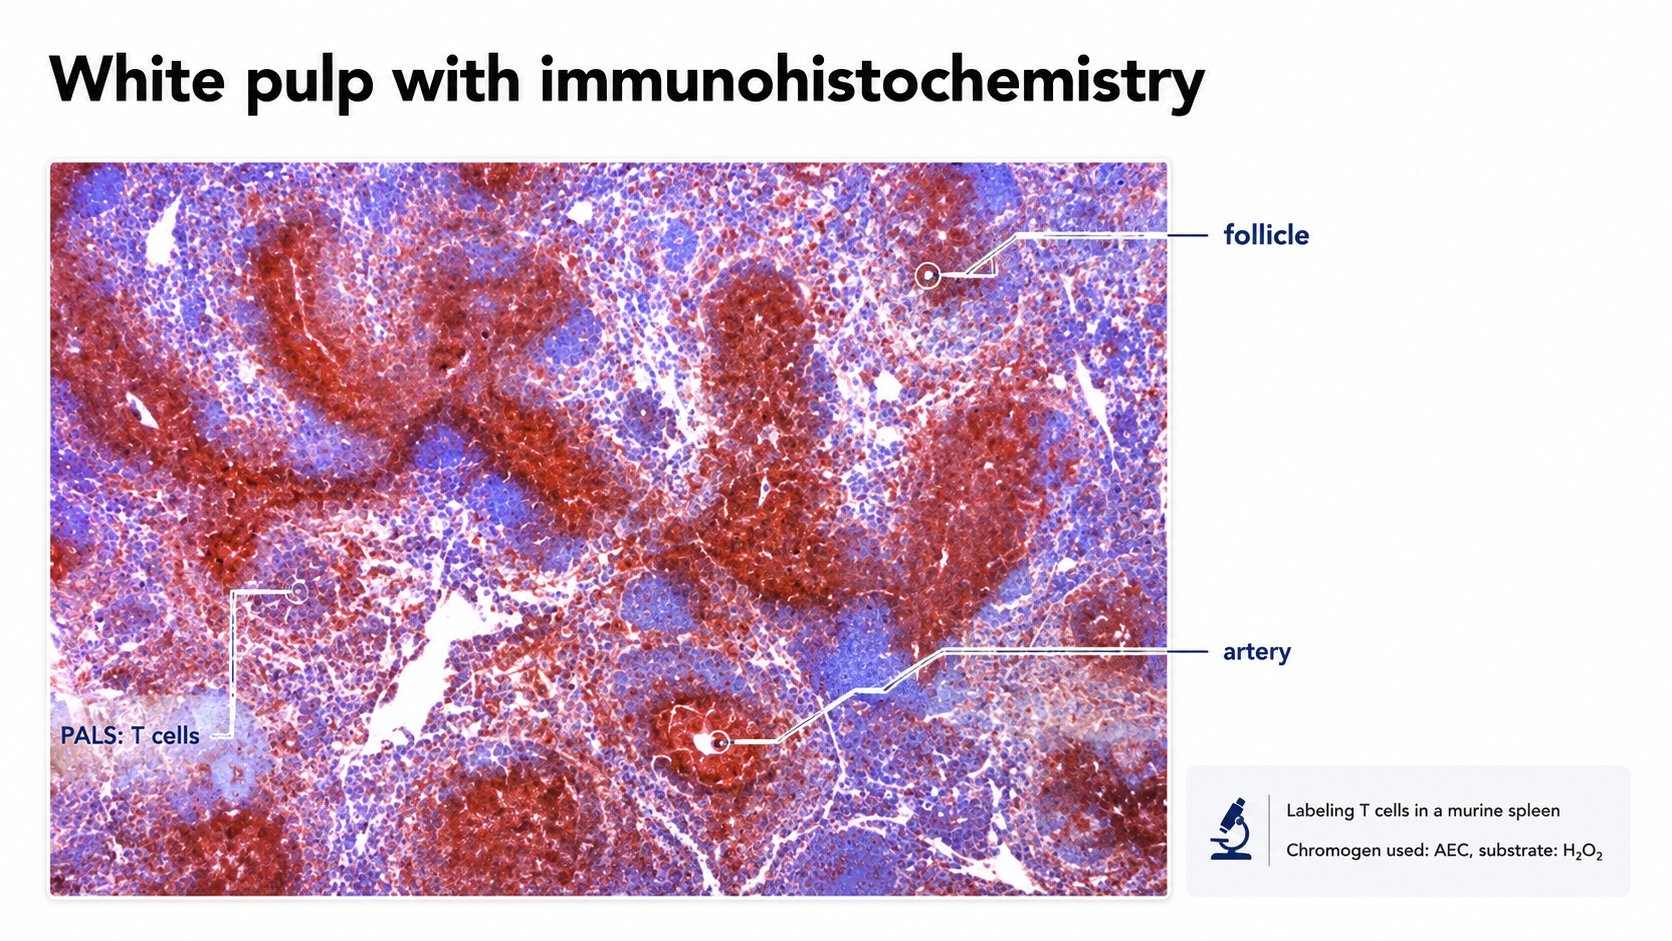
After: Redesigned slide 31 with annotated white pulp microscopy
Clean microscopy with AI overlay annotations for PALS, follicles, and marginal zone
32

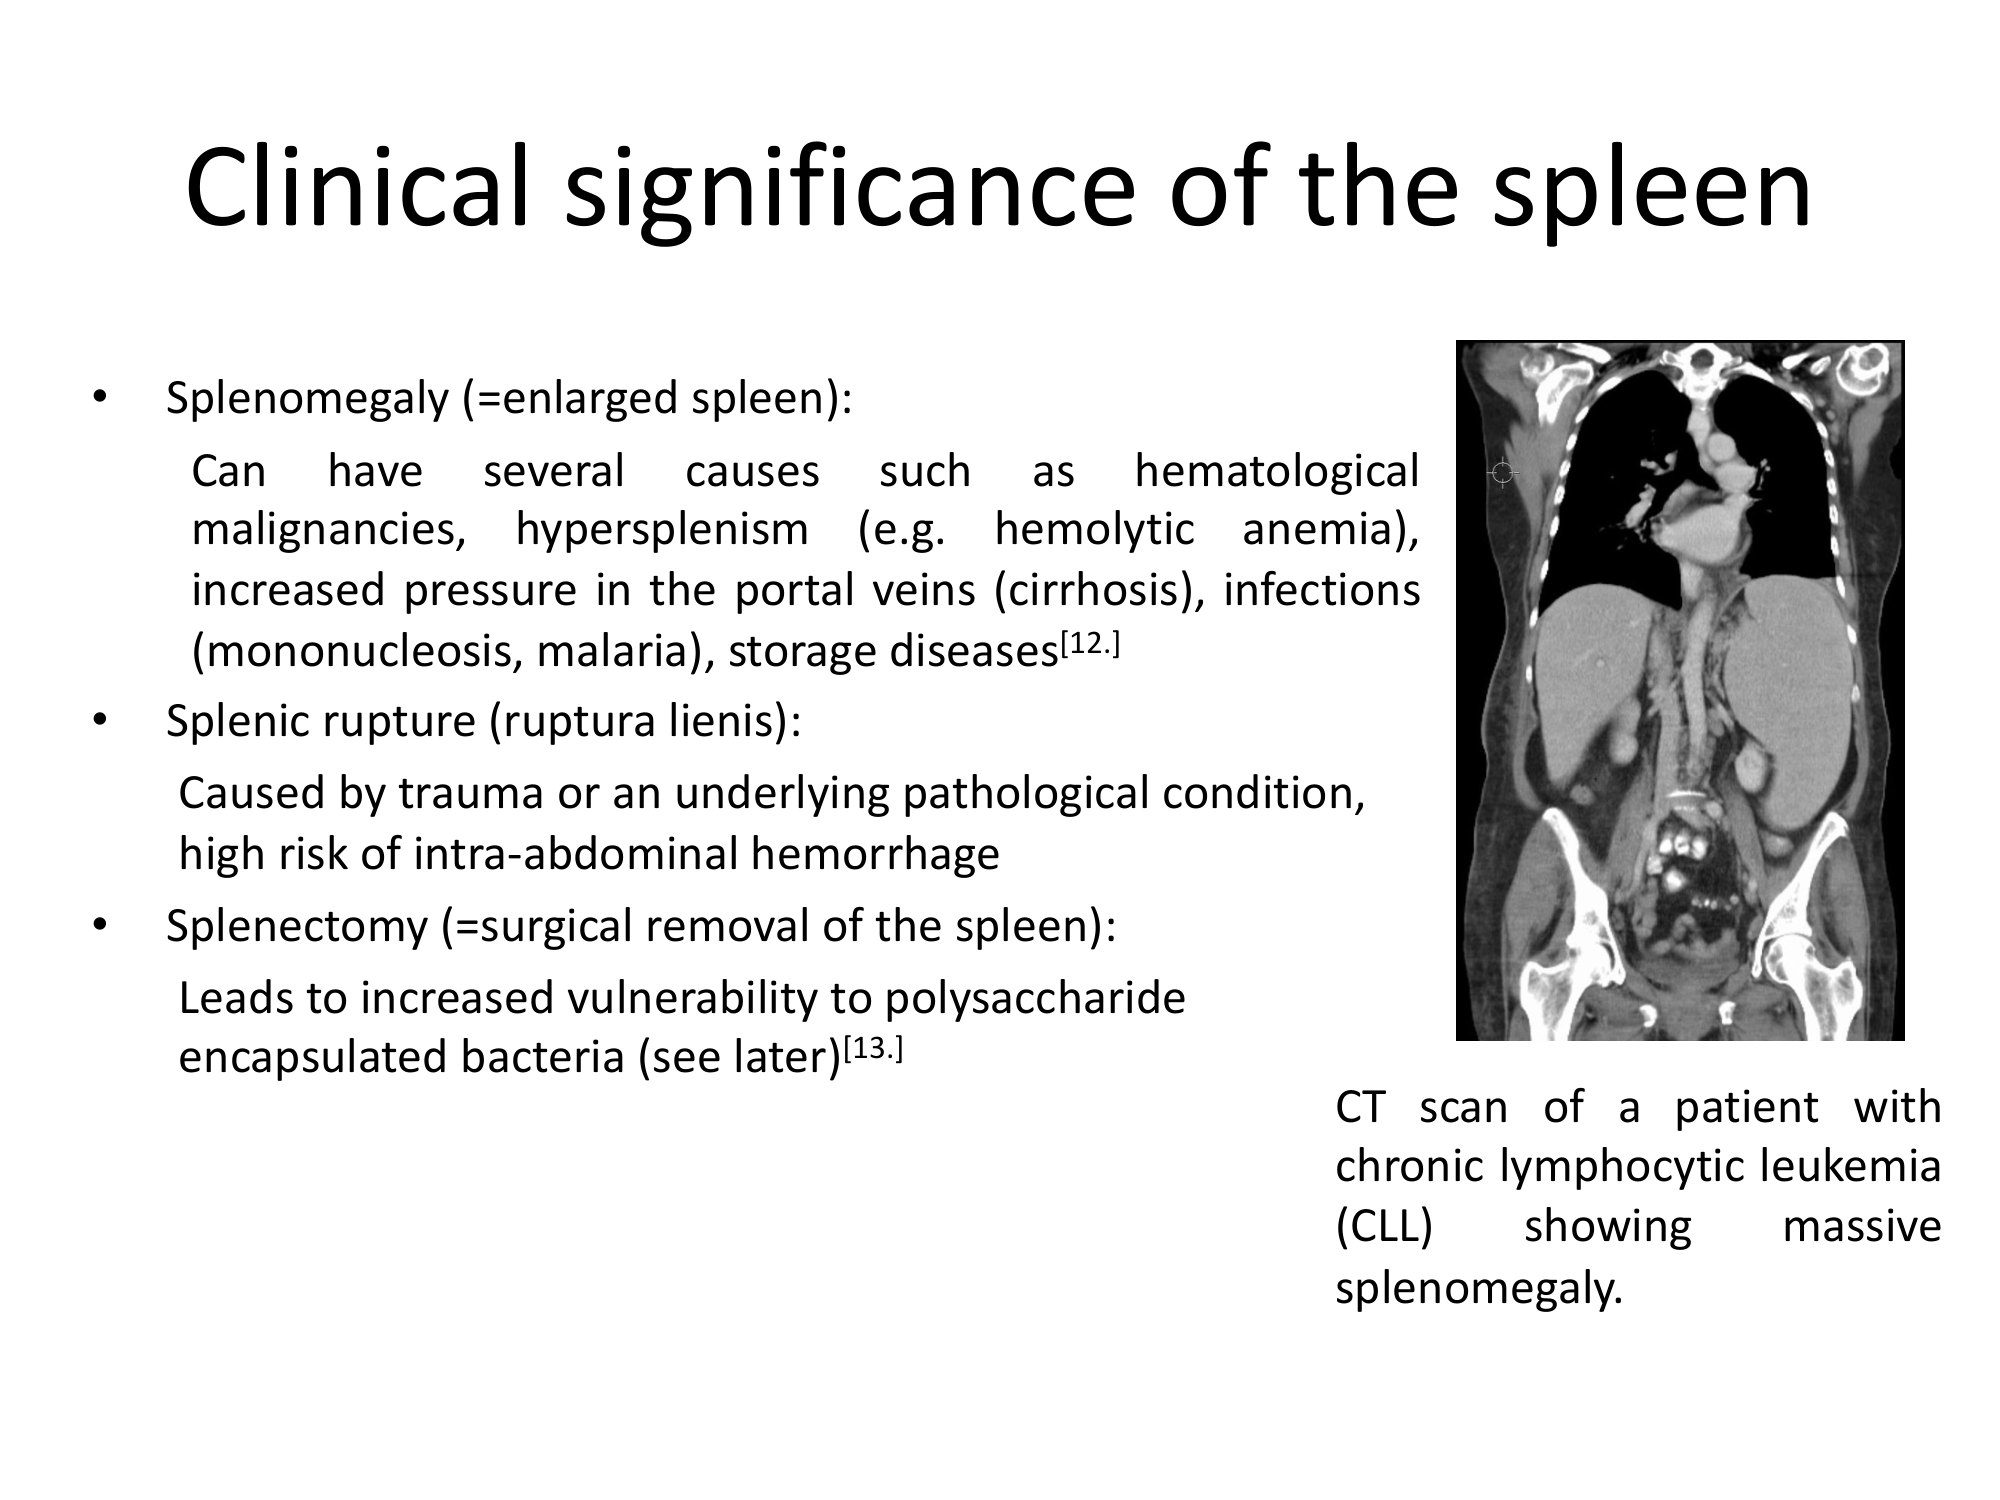
Clinical Significance of the Spleen — Splenomegaly

CT scan showing splenomegaly with minimal clinical context. The redesign presents the clinical imaging with diagnostic annotations and a side-by-side normal vs. enlarged spleen AI illustration.

Before
Before: Original slide 32 — splenomegaly CT scan
CT scan of splenomegaly, minimal labeling and context
After
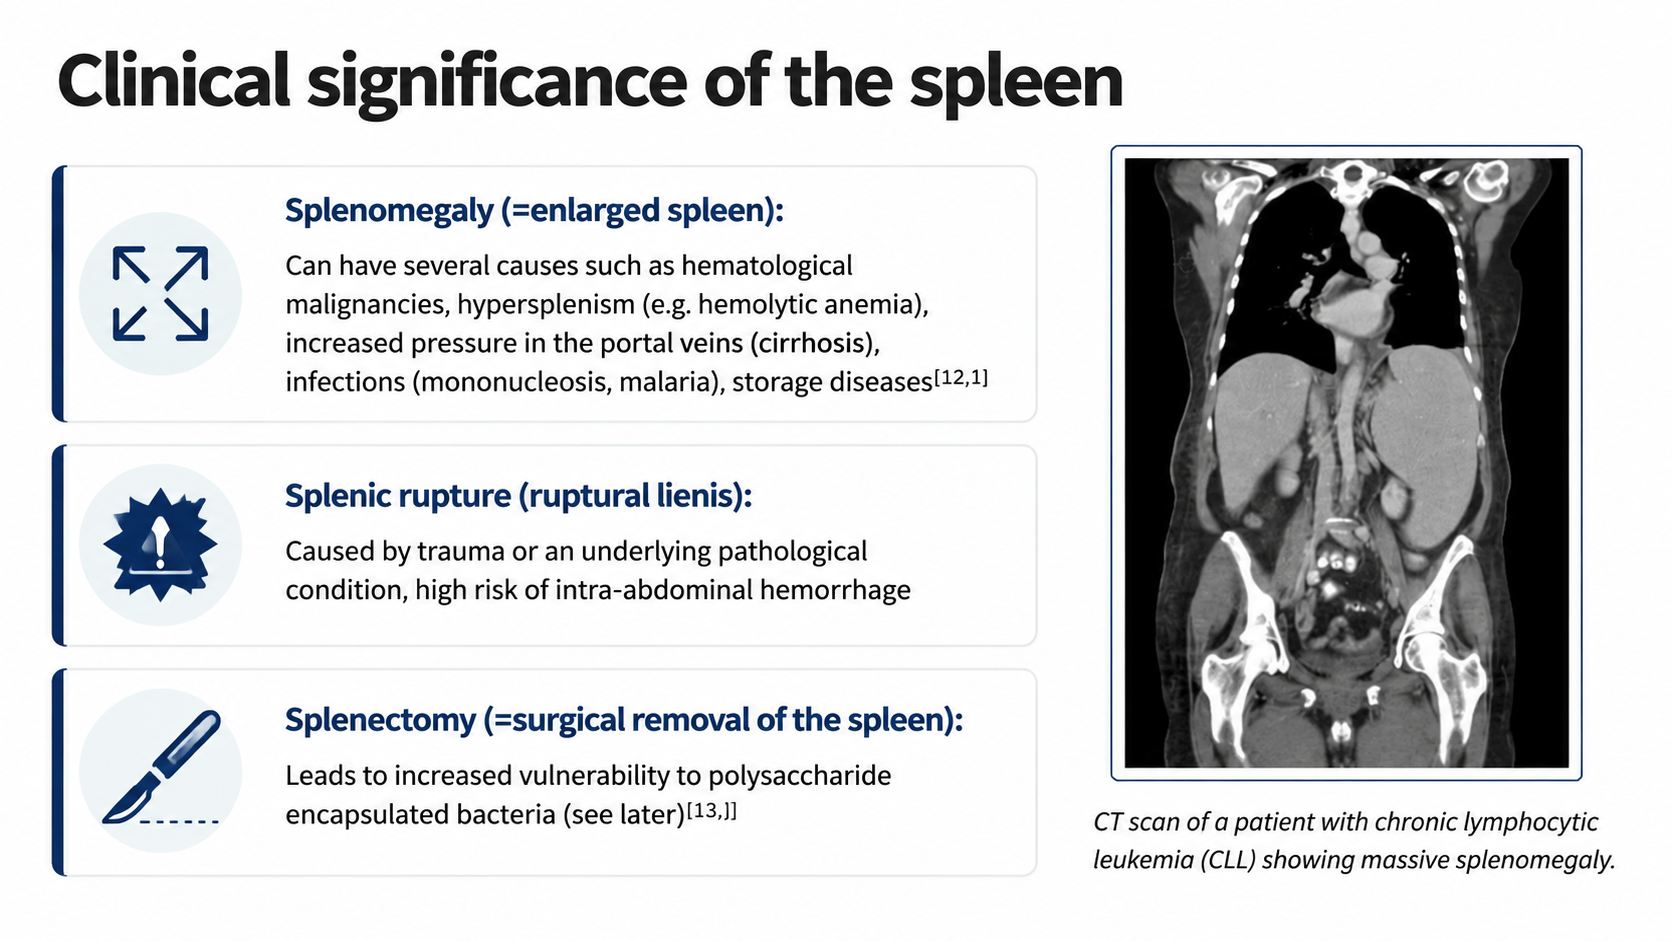
After: Redesigned slide 32 with annotated splenomegaly comparison
Diagnostic annotations with AI normal vs. enlarged spleen comparison
33

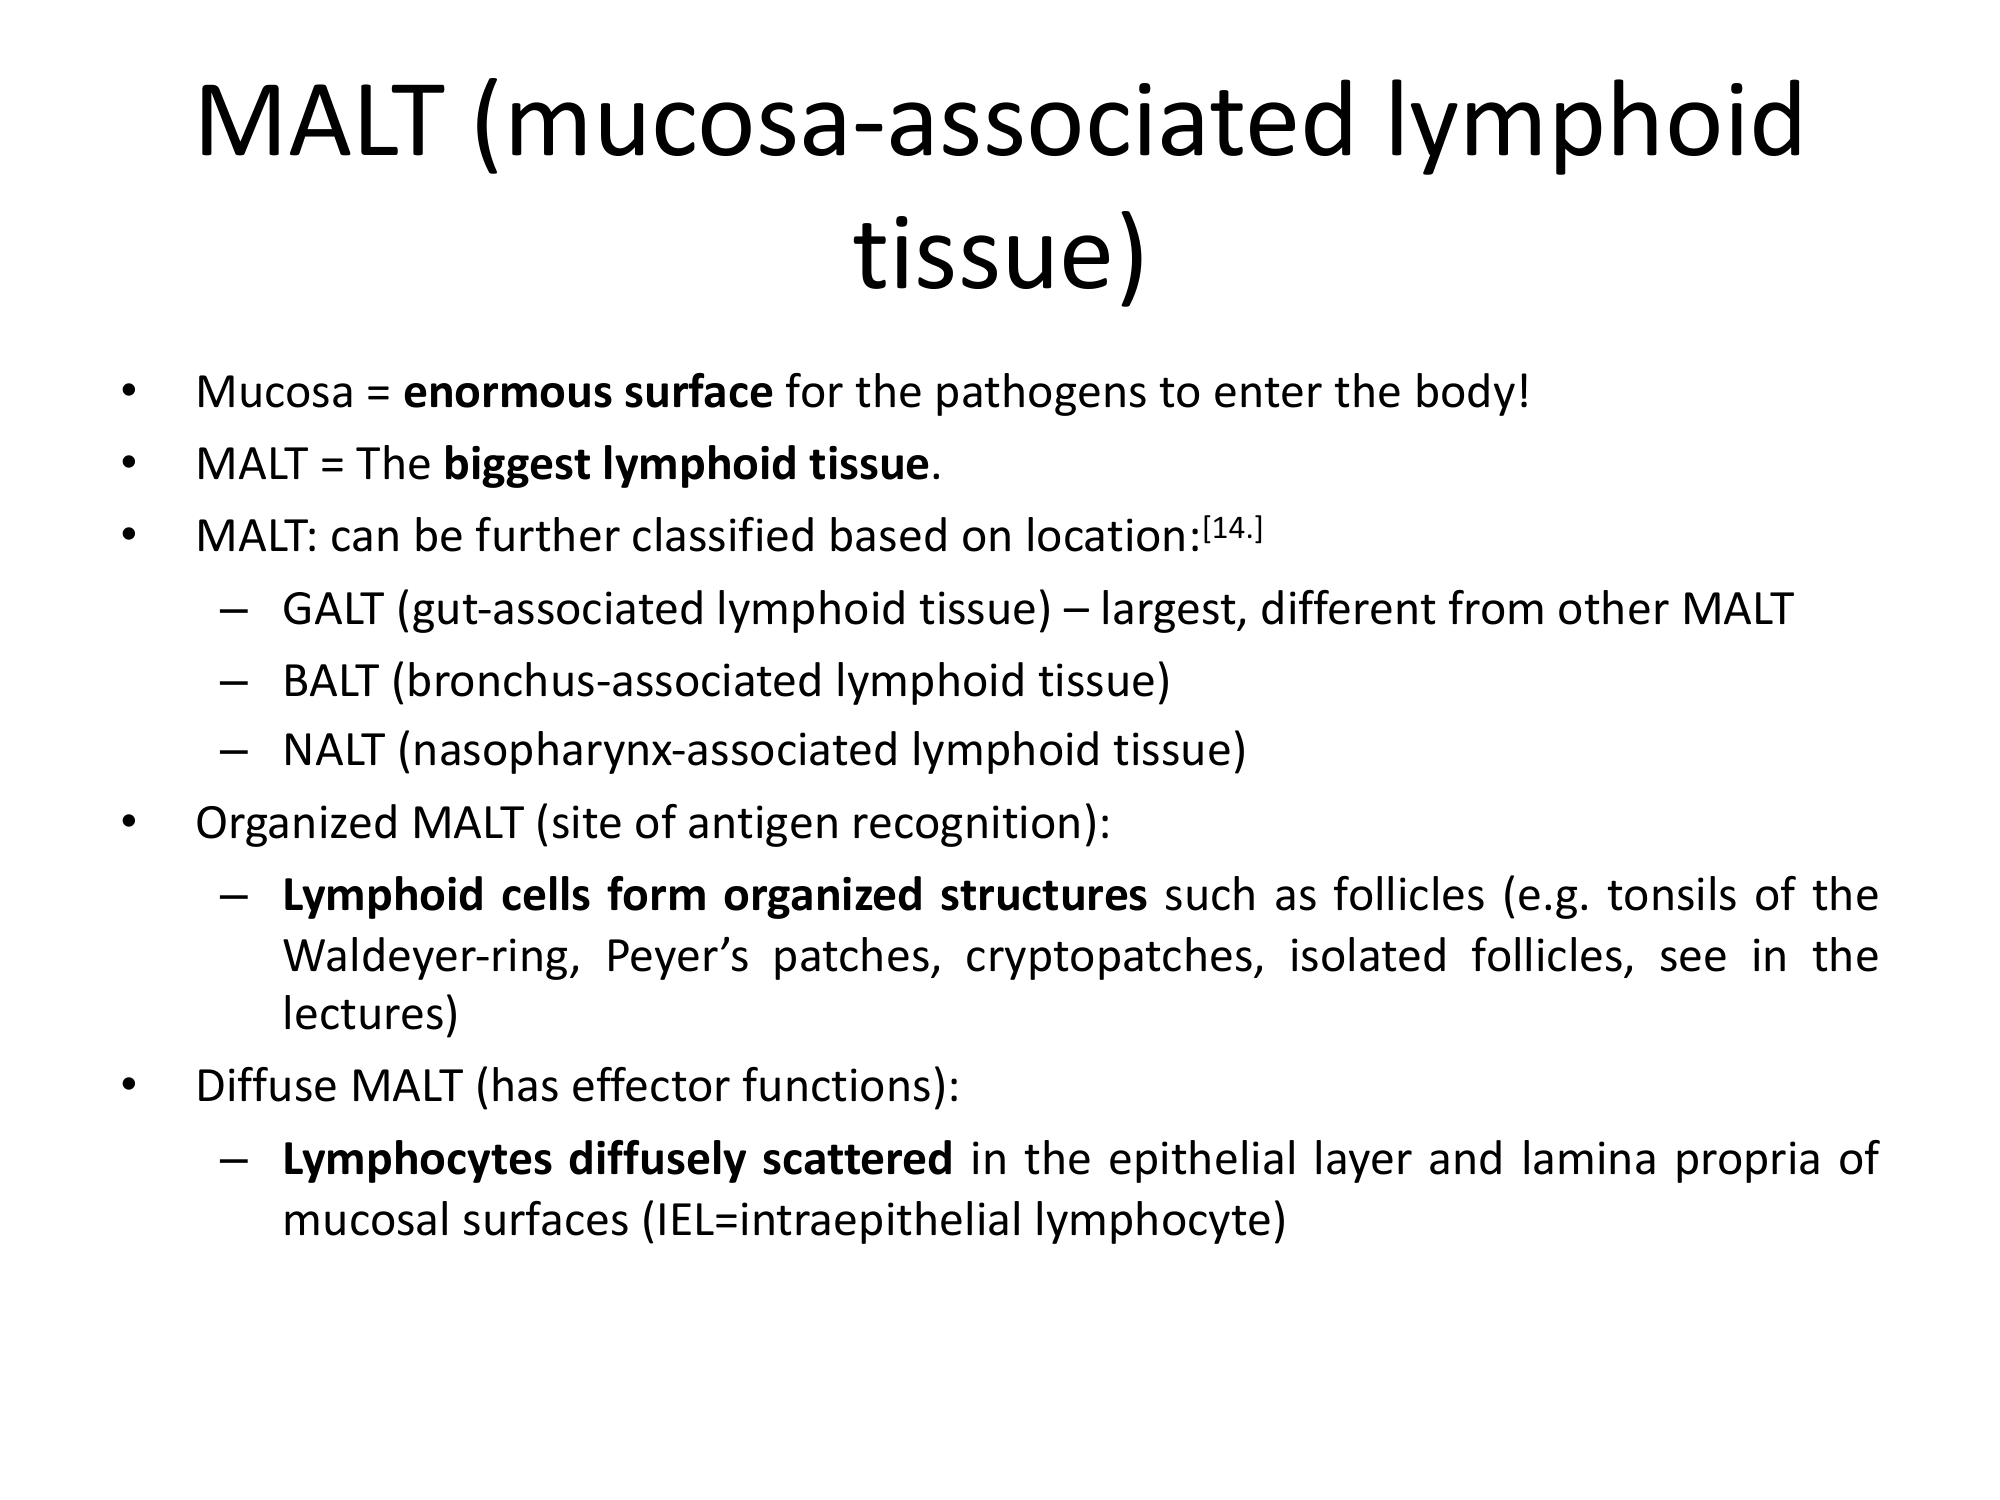
MALT — Mucosa-Associated Lymphoid Tissue

Text describing GALT, BALT, and NALT classifications. The redesign transforms the text into a visual taxonomy with AI-generated anatomical thumbnails showing each MALT location in the body.

Before
Before: Original slide 33 — MALT text classification
Text-only MALT classification, no anatomical visuals
After
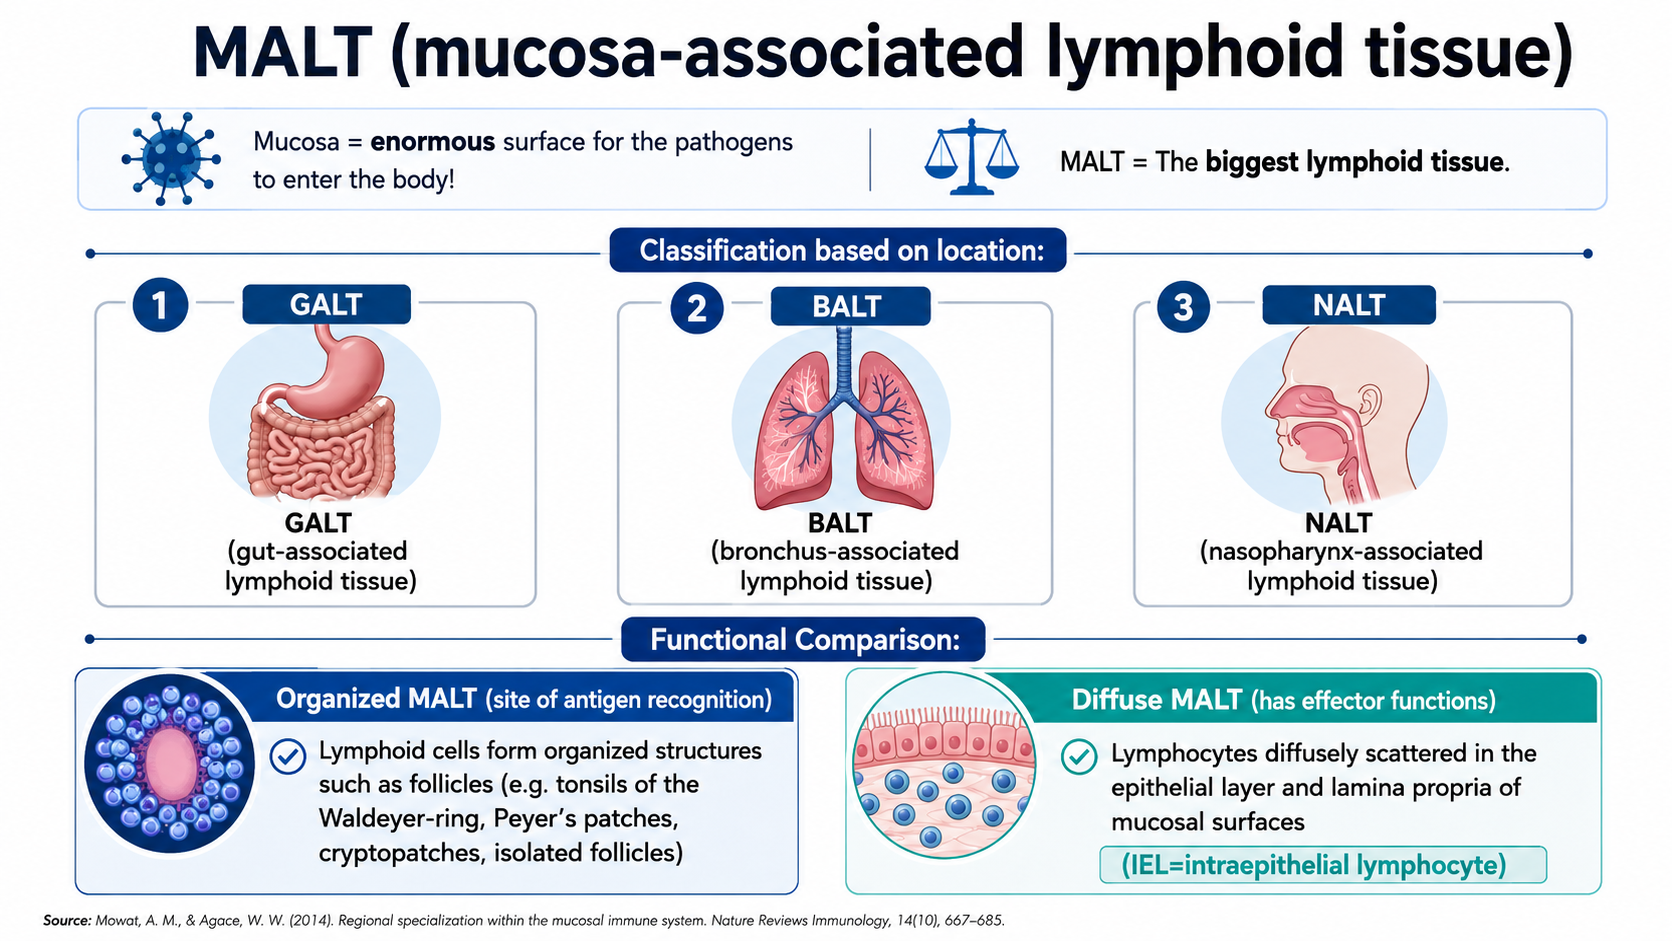
After: Redesigned slide 33 with visual MALT taxonomy
Visual taxonomy with AI-generated anatomical thumbnails for each MALT type
34

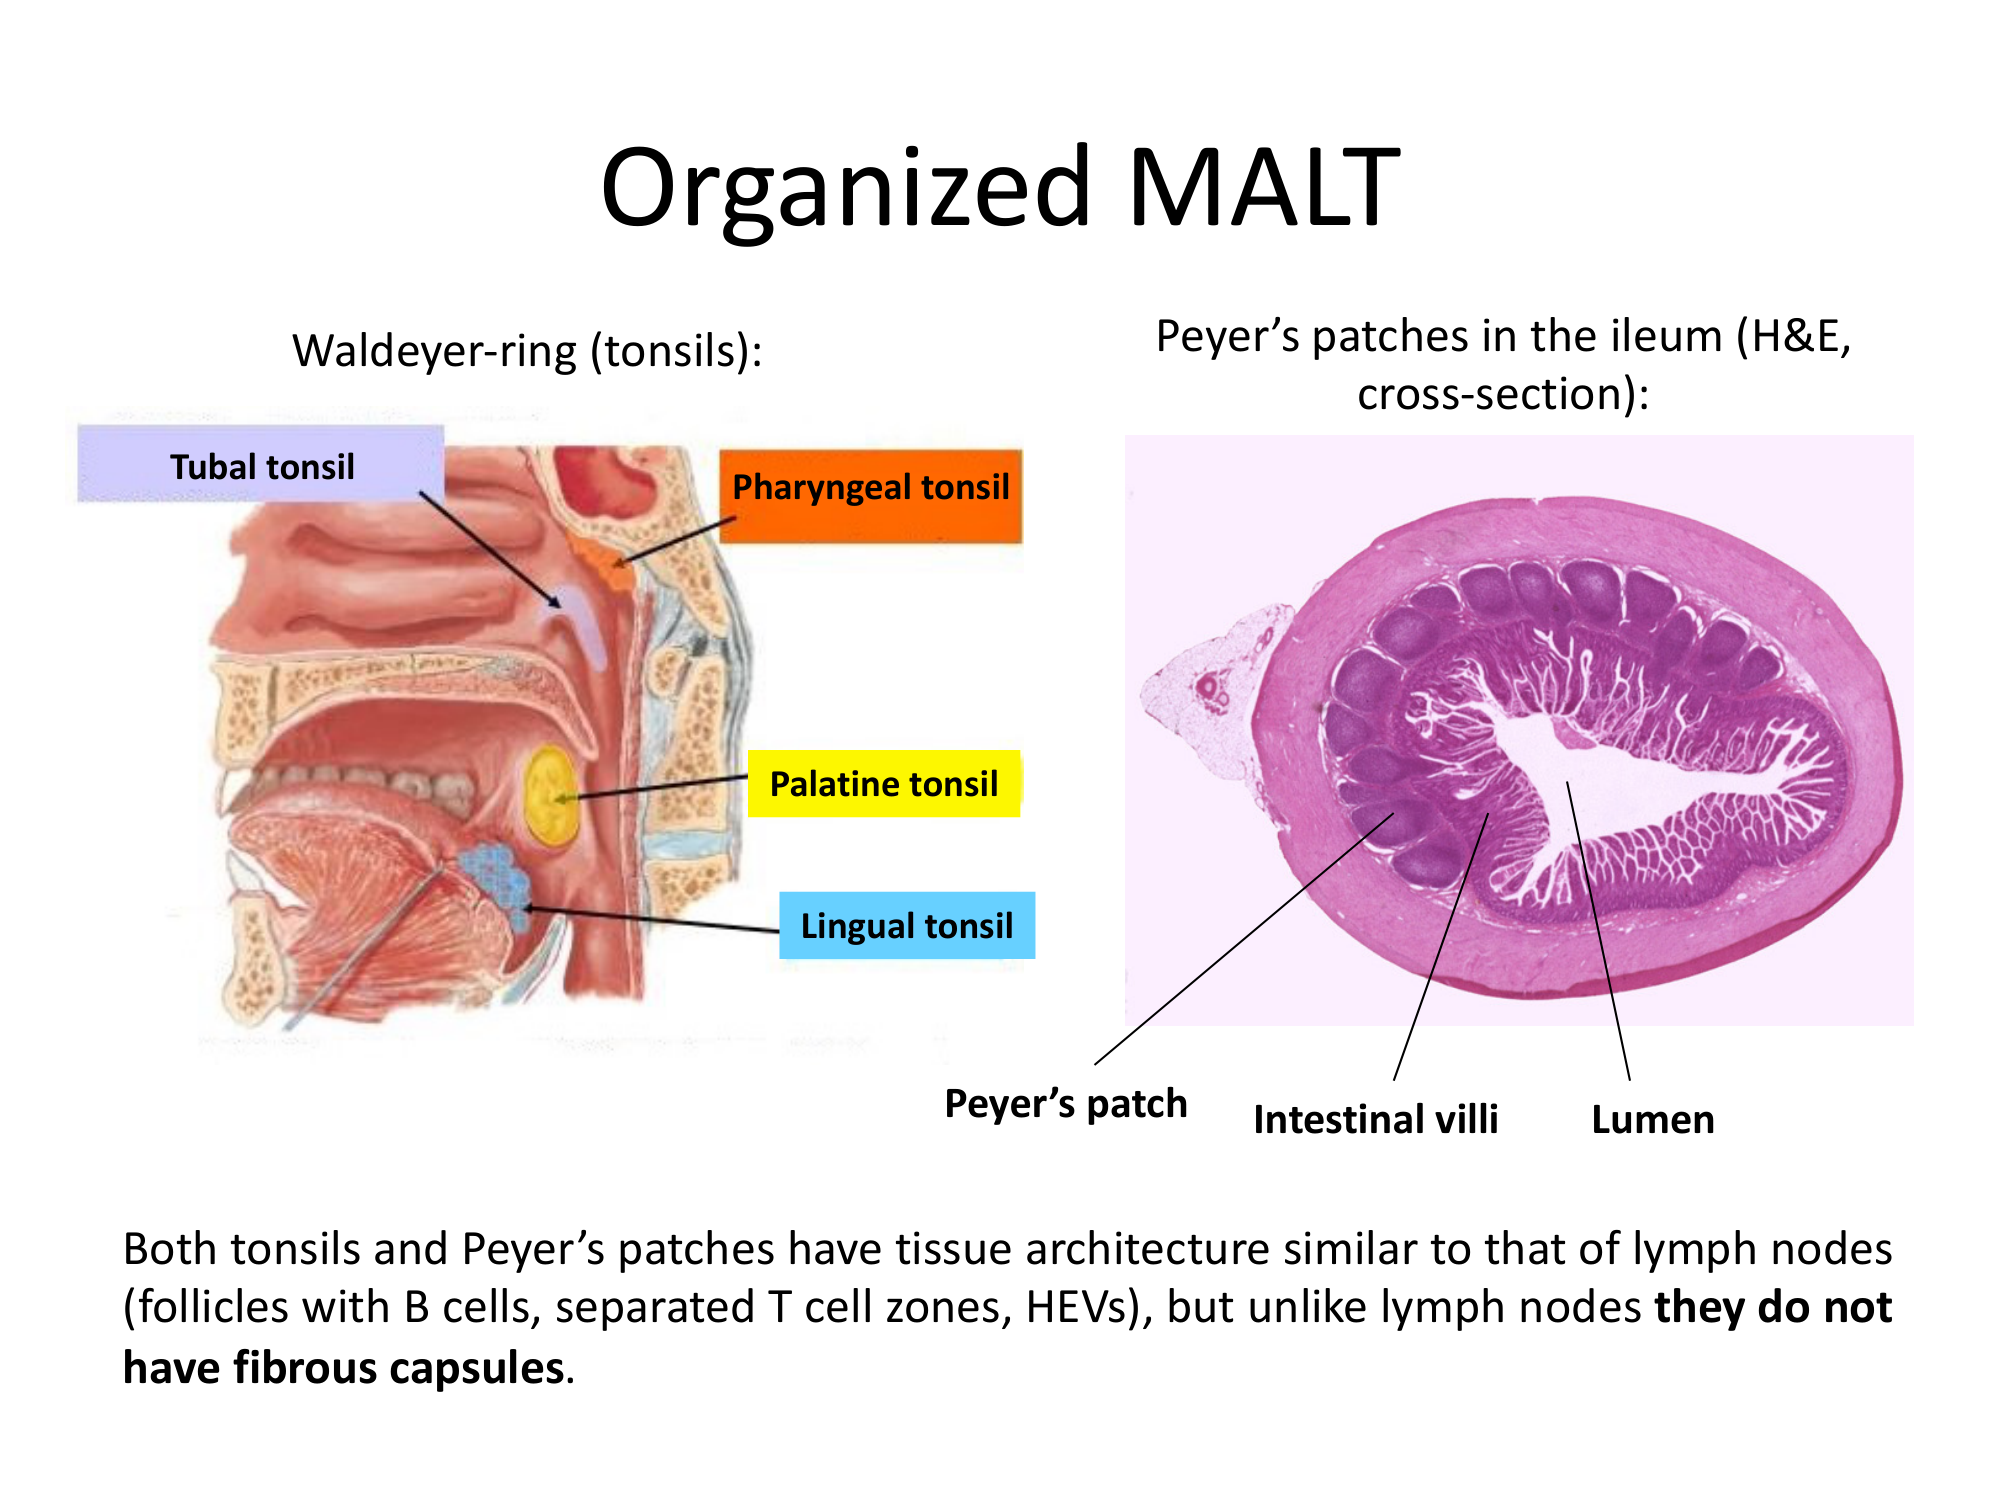
Organized MALT — Waldeyer Ring & Peyer's Patches

Tonsil diagram (Waldeyer ring) with Peyer's patches histology. The redesign generates AI illustrations of the Waldeyer ring anatomy and Peyer's patch cross-sections with labeled immune cell zones.

Before
Before: Original slide 34 — Waldeyer ring and Peyer's patches
Generic tonsil diagram and Peyer's patches histology, mixed sources
After
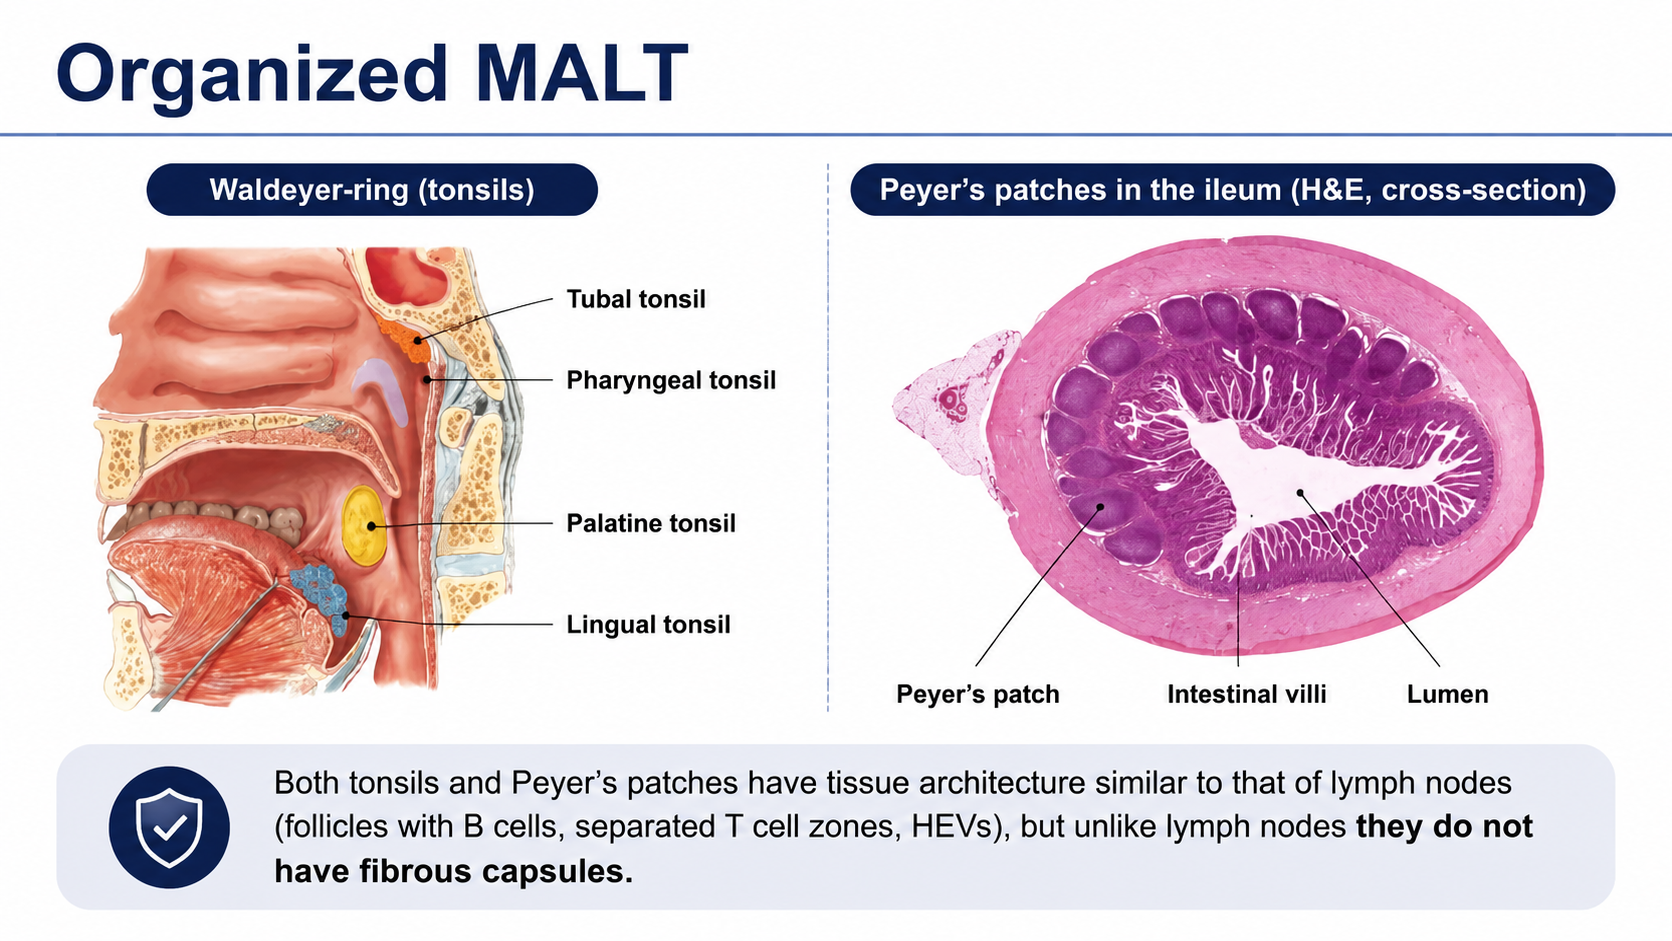
After: Redesigned slide 34 with AI Waldeyer ring and Peyer's patch illustrations
AI-generated Waldeyer ring anatomy and Peyer's patch cross-sections with labeled zones
35

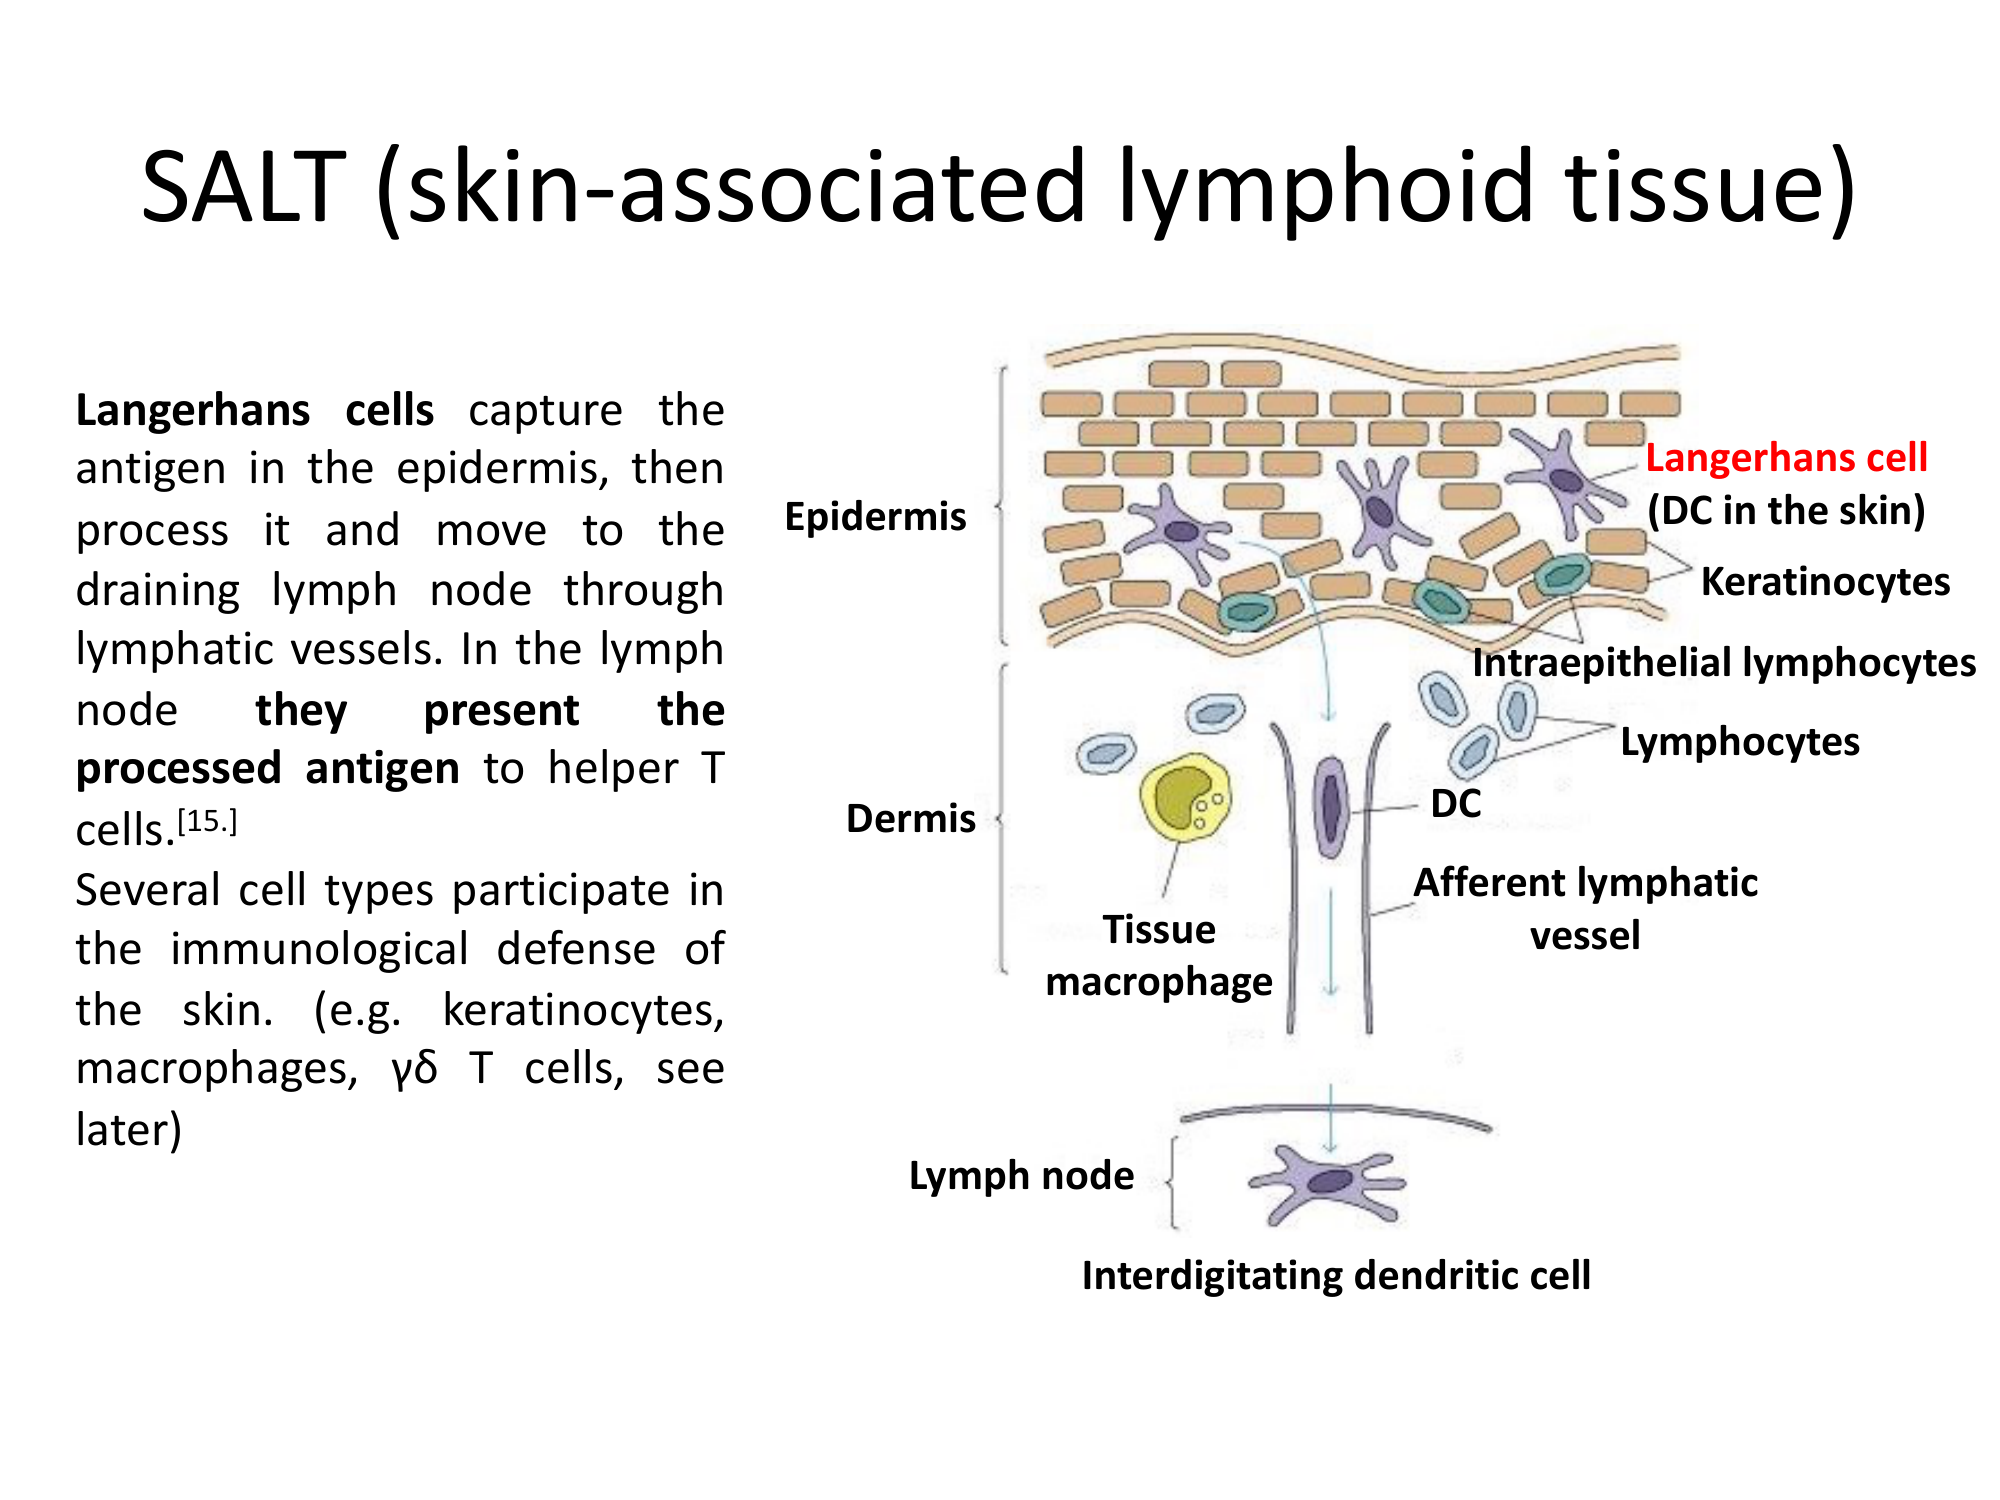
SALT — Skin-Associated Lymphoid Tissue

Skin layers diagram showing immune cell distribution. The redesign generates a precise AI illustration of skin cross-section with epidermis, dermis, and subcutis layers showing Langerhans cells, dendritic cells, and T cells in their anatomical positions.

Before
Before: Original slide 35 — skin layers with immune cells
Generic skin layers diagram with immune cells, low resolution
After
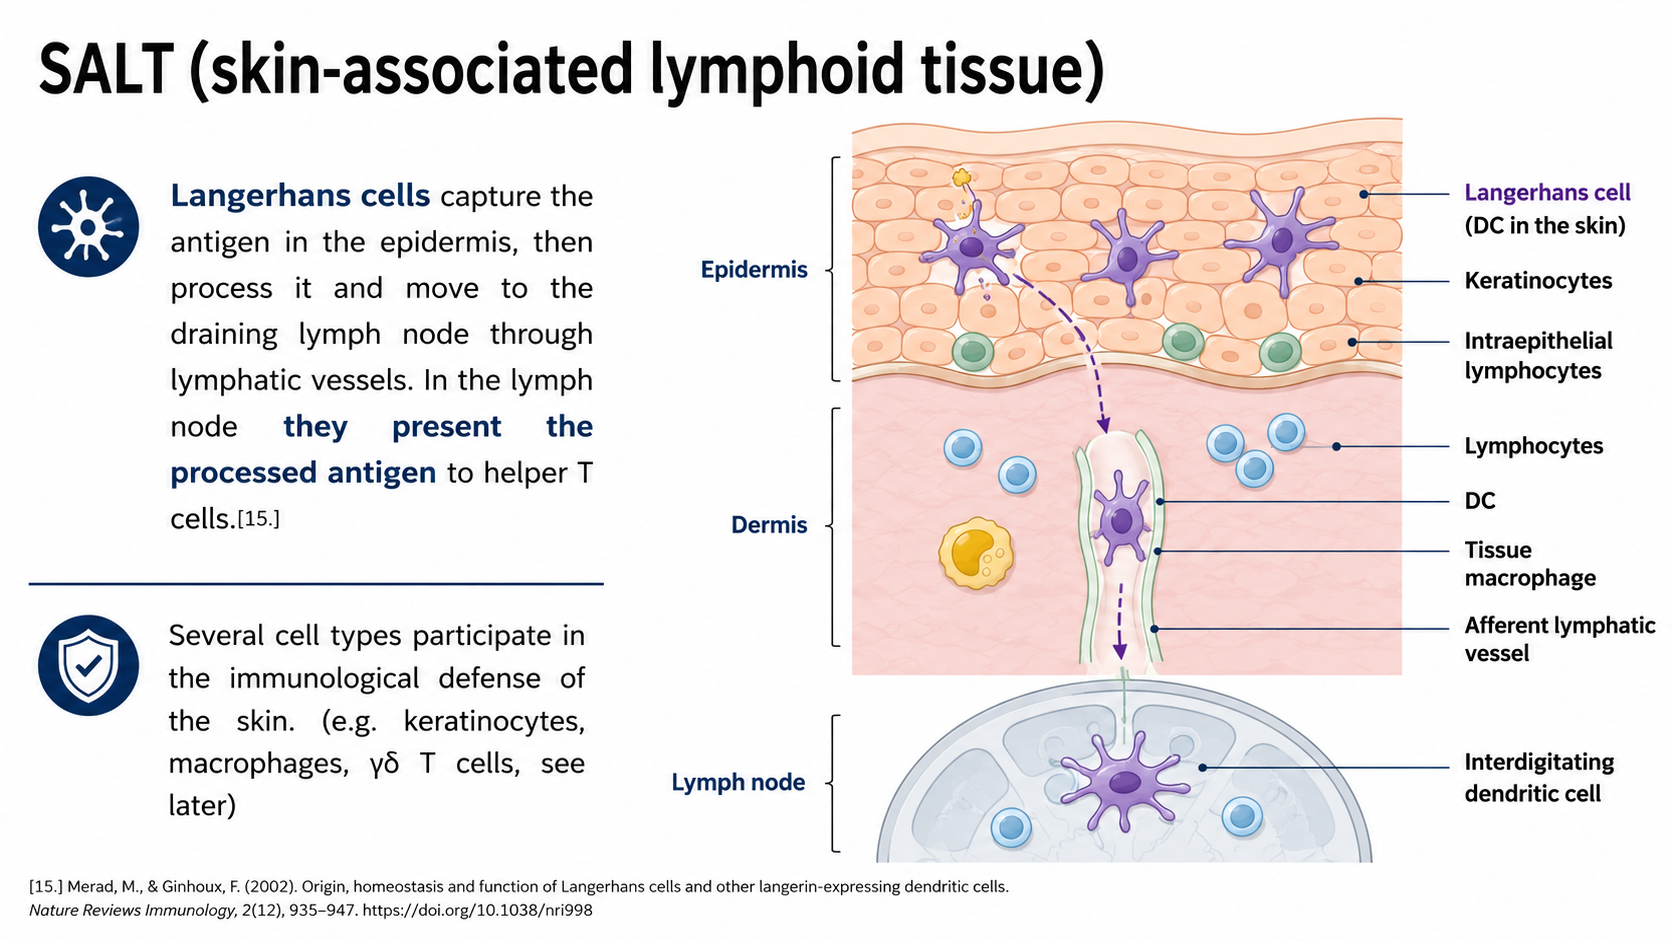
After: Redesigned slide 35 with AI-generated skin cross-section
AI-generated skin cross-section with immune cells in precise anatomical positions
36

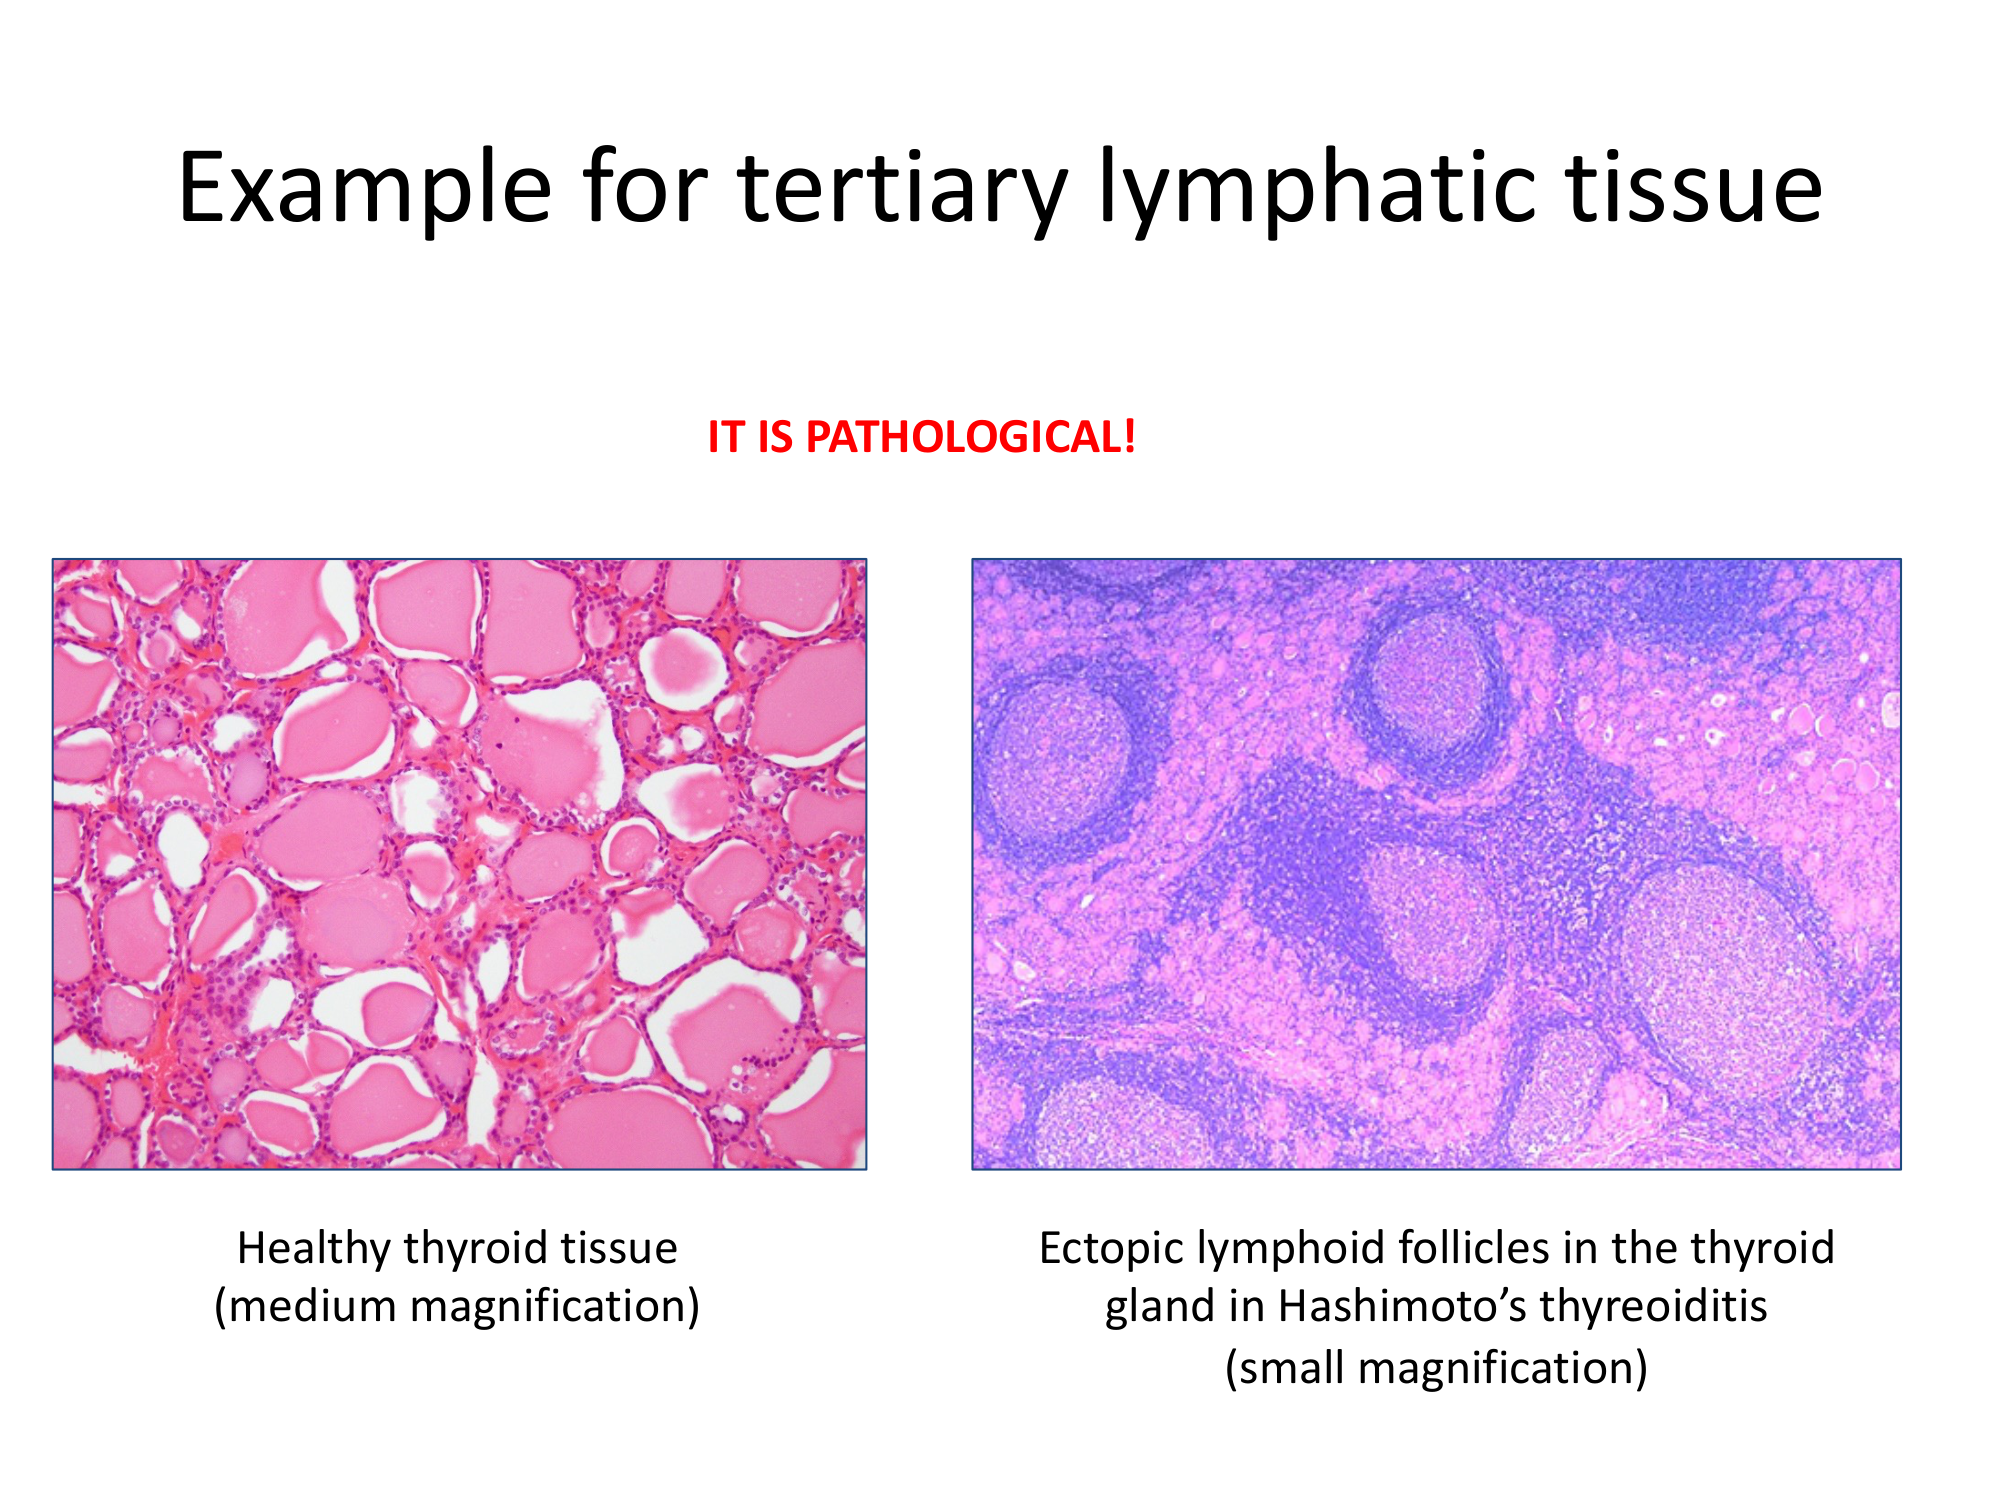
Tertiary Lymphatic Tissue — Thyroid Comparison

Thyroid tissue comparison microscopy showing tertiary lymphoid structure formation. The redesign presents a clean side-by-side comparison with AI-annotated histology highlighting the lymphoid infiltrate patterns.

Before
Before: Original slide 36 — thyroid tissue comparison microscopy
Basic microscopy comparison, minimal annotation
After
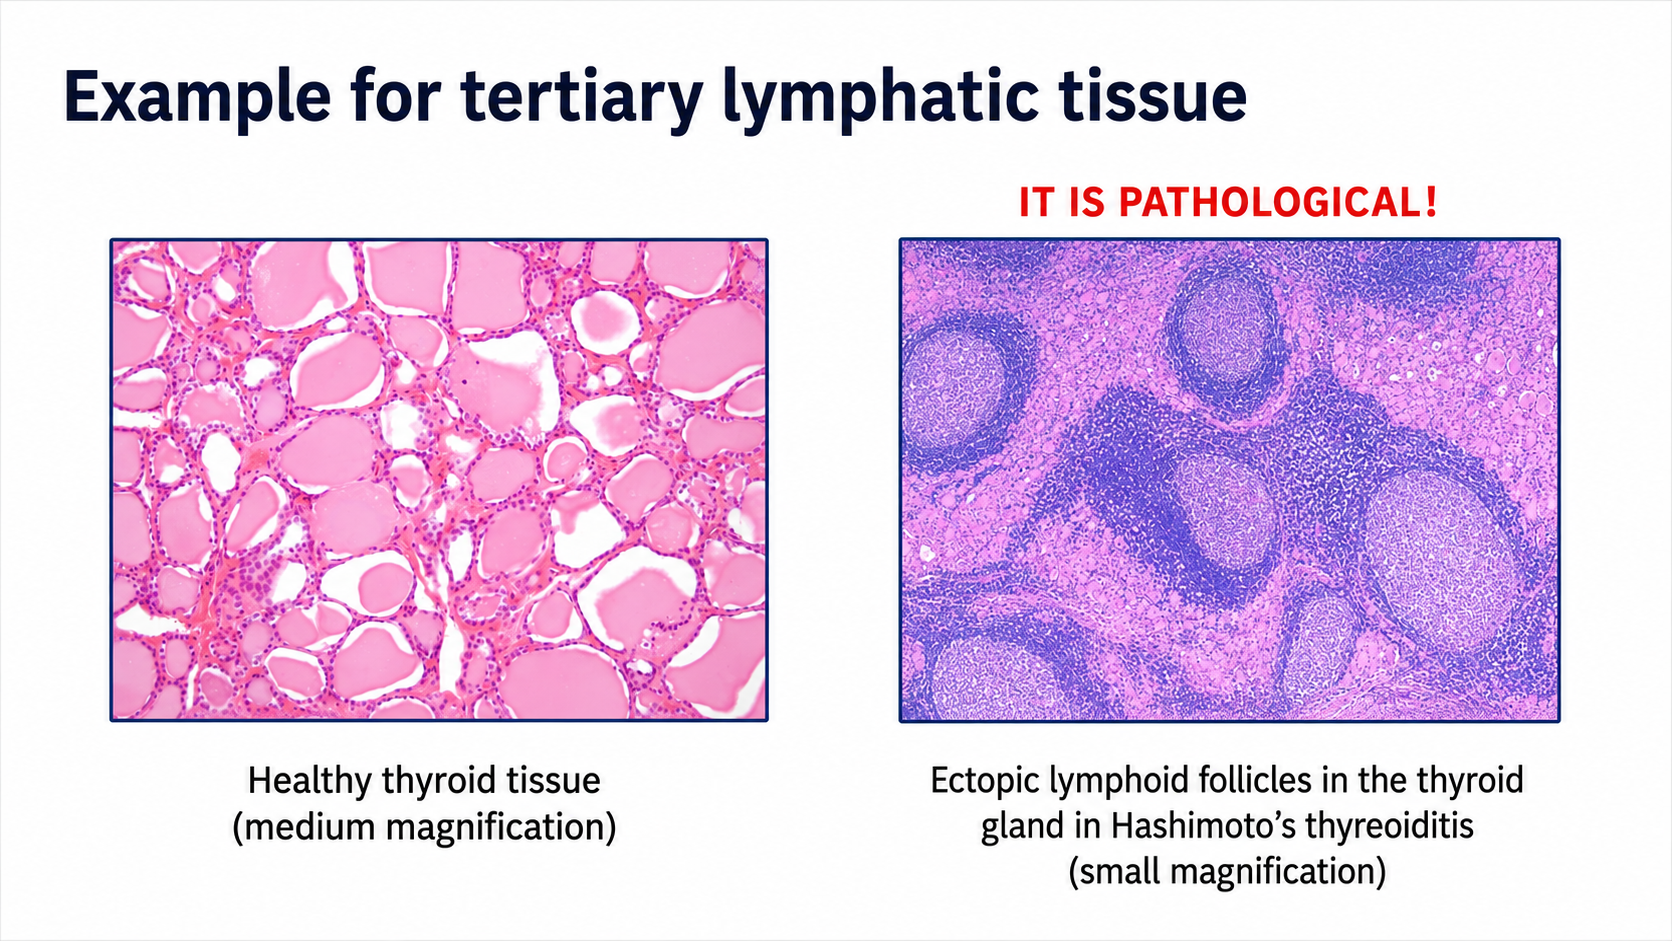
After: Redesigned slide 36 with annotated thyroid histology comparison
AI-annotated histology with highlighted lymphoid infiltrate patterns
37

Thank You — Feedback & Contact

Plain closing slide with feedback contact information. The redesign creates a polished closing card with clean typography and a cohesive visual finish.

Before
Before: Original slide 37 — plain thank you slide
Plain closing slide, basic text layout
After

After: Redesigned slide 37 with polished closing card
Polished closing card with cohesive visual identity

Transform Your Medical Lectures in Minutes

Upload your deck, pick a style, and let Arty generate precise medical illustrations. Your content stays — the visuals level up.

Try Deckly.art Free